- Intraday Comment
-
30.11.2016, 2pm
• The dollar traded mixed against its G10 peers during the European morning Wednesday. It was higher against NZD, JPY and AUD in that order, while it traded lower versus NOK, SEK, CAD and EUR. The greenback remained virtually unchanged against GBP and CHF.
• Oil prices surged in the past few hours, amid a plethora of optimistic comments from OPEC officials regarding the prospect of a deal. The positive atmosphere was kicked off by Iran, who stated that even though it is not willing to freeze its output, it will come to another agreement with OPEC. This was followed by comments from Iraq that it is willing to cut production and subsequently, Saudi Arabia, which indicated that pre-sanction levels for Iran are acceptable. Even Russia said it’s ready to cut if OPEC agrees. Having all these signals in mind, we believe that the likelihood for some form of a deal has risen considerably. If indeed we were to see an accord, the magnitude of the surge in WTI would likely depend on two things: the size of any potential cut and whether or not it’s accompanied by a mechanism to ensure that each country does not violate its quota. In case of only a small cut, WTI prices could rise somewhat further, but it seems unlikely that this would lead to a sustained rally. For this to happen, any cut would need to be complemented by the aforementioned measures. Should OPEC fail to deliver anything though, we could see oil prices correct sharply lower, especially following this morning’s speculative surge.
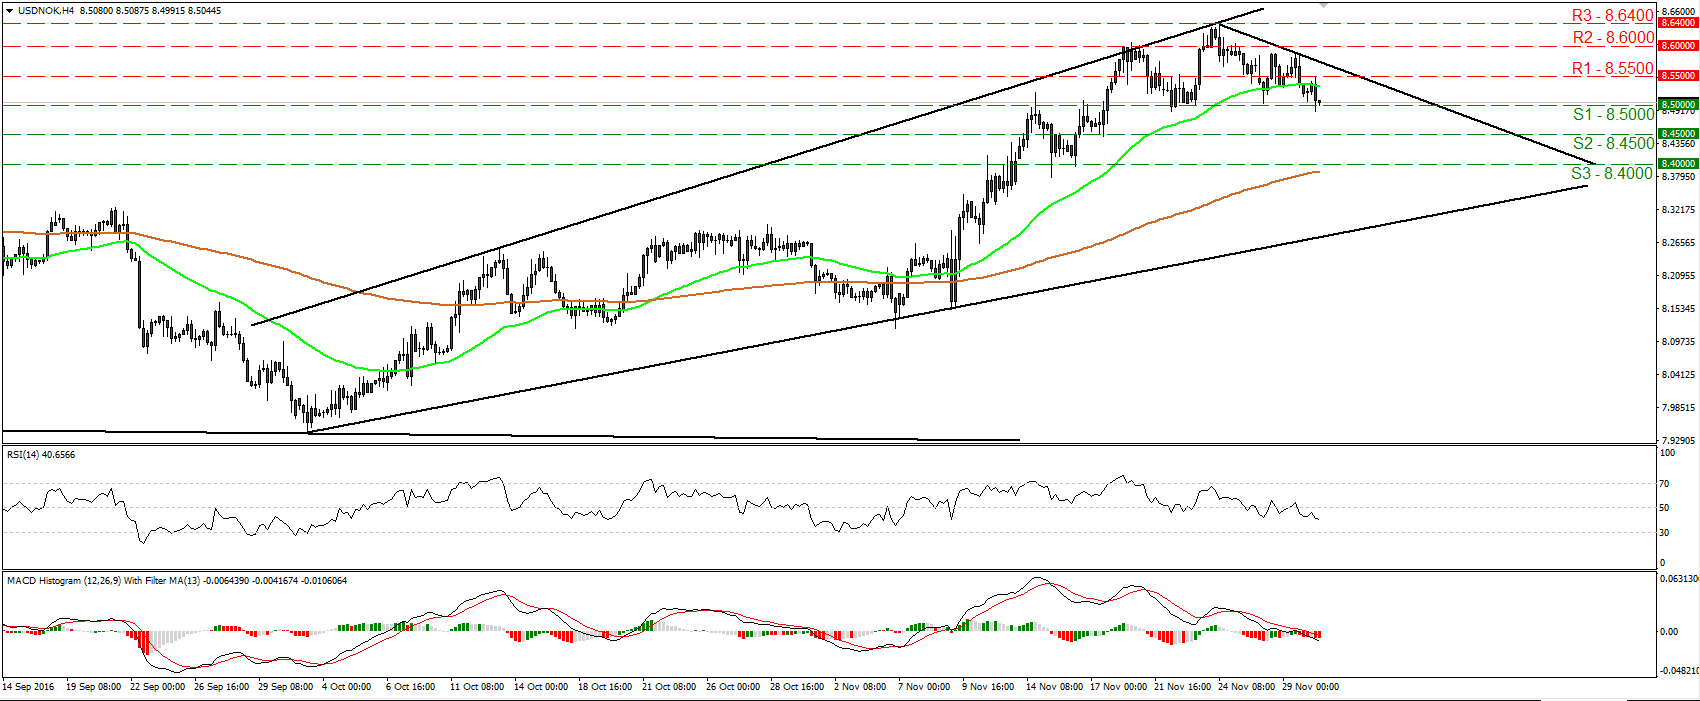
• USD/NOK traded lower during the European morning Wednesday after it hit resistance at 8.5500 (R1). At the time of writing, the pair is testing the 8.5000 (S1) psychological territory, where a clear dip is likely to open the way for the next support territory of 8.4500 (S2). The fact that the rate is trading below the short-term downtrend line taken from the peak of the 24th of November increases the possibilities for further declines. This is also supported by our short-term oscillators. The RSI fell below its 50 line and looks able to continue trending north, while the MACD stands below both its zero and trigger lines and points down. Switching to the daily chart, I see that the rate is still trading above the medium-term uptrend line taken from back at the low of the 3rd of October. This keeps the medium-term outlook positive and as such, I would treat any short-term declines that stay limited above the aforementioned uptrend line as a corrective phase.
• Support: 8.5000 (S1), 8.4500 (S2), 8.4000 (S3)
• Resistance: 8.5500 (R1), 8.6000 (R2), 8.6400 (R3)