IronFX Daily Commentary | 27/03/15
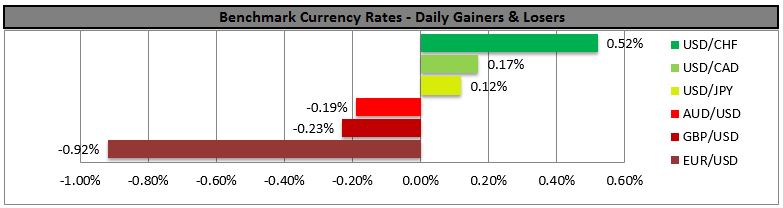
US yields rise on jobless claims, USD benefits EUR/USD did manage to get over 1.10 yesterday for a relatively long time – about five hours – but it was already back below that level when the US jobless claims came out better than expected. Even if many of the US economic indicators are missing expectations, the labor data remains strong, and that’s one of the two key points for the Fed. Growth isn’t in the Fed’s mandate, “maximum employment” is. Signs of continuing strong employment sent Fed funds rate expectations and bond yields higher and supported the dollar all around. Talk of the end of the dollar rally was quite premature! The markets will be waiting to hear what Fed Chair Janet Yellen has to say on the topic later today (see below).
Japanese data as expected Early Friday we had the usual end-of-month data dump from Japan. The key point was that the Bank of Japan’s measure of inflation that takes into account last year’s hike in the consumption tax showed inflation at zero in February. So much for their goal of hitting 2% inflation by April 2015! The jobless rate and job offers-to-applicants’ ratio, also for February, both improved as expected. The government hopes that this tightening labor market will put pressure on companies to raise wages, which would help to create “good” demand-pull inflation (instead of “bad” cost-push inflation caused simply by oil prices rising, which eats into peoples’ purchasing power). Dream on. Household spending for February fell on a yoy basis, although not as much as expected, and retail trade rose less than expected on a mom basis – although large retailers’ sales beat expectations. Some major companies have increased their wages modestly, but there’s no sign yet that households in general are feeling any richer or spending any more as a result. I expect Japan will continue to rely on monetary stimulus and currency depreciation for growth, which is why I remain bearish JPY.
More on why I’m bearish on oil Yesterday I observed that at the current rate, storage at the main US oil distribution facility of Cushing, Oklahoma will be full by the end of June. I’d like to elaborate on that point to explain why I’m still bearish on oil (assuming no disaster in the Middle East).
Everyone thought that US production would drop as prices dropped because so much of US production is from “fracking,” which is expensive. However, that hasn’t happened. On the contrary, US oil production keeps climbing and may be at a record level. However, US producers aren’t allowed to export oil. So much of the increased supply is going into storage. Inventories have risen for 11 weeks in a row, the longest rising streak on record, and are now at record levels, too.
Unfortunately there’s a limit to how much oil they can put in storage. There’s just so many oil tanks in the world. Inventories at Cushing have been rising by a little over 2mn barrels a week this year. Cushing only has storage for 85mn barrels of oil. At this rate, all the tanks in Cushing will be full by late June. After that, there’s nothing they can do except to dump the oil on the market at any price.
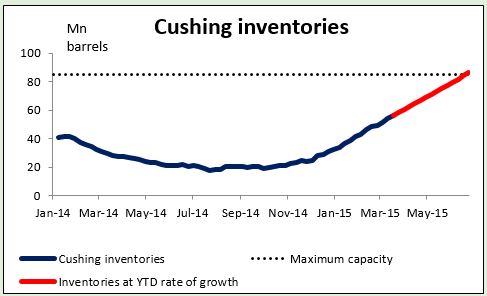
That would be bad enough, but it gets worse! Production in the US is likely to rise, because of regulations in North Dakota, the #2 oil-producing state after Texas. There are around 125 wells in the state that have to be finished by the end of June in order to comply with state requirements to complete drilling within a year. At the same time, oil taxes in North Dakota will probably fall in June, because the state reduces taxes when prices average below a certain level for five consecutive months. That would mean most of the wells in the state will be exempt from the oil extraction tax. The combination of that tax break and many wells running up against one-year state deadlines means an increase in production in North Dakota.
So in June, US oil production is likely to surge just as the storage tanks get full! If that happens, then oil prices may plunge. Actually, they’re likely to plunge before that, as investors get ready for the eventuality. That’s why I’m bearish on oil over the next several months – and on the oil currencies, particularly CAD, NOK, AUD and RUB.
Of course, this depends on my assumption that the fighting in the Middle East doesn’t interfere with oil production or shipping there. If it does, then all bets are off. That could change the total environment for financial markets.
Today’s highlights: During the European day, French consumer confidence for March is coming out.
From Sweden, retail sales for February are forecast to decelerate a bit. Following the poor economic tendency survey released on Tuesday, another weak figure is likely to weaken SEK somewhat.
In Norway, the official unemployment rate for March is expected to remain unchanged at 3.0%, while retail sales for February are forecast to rebound from the previous month. On top of the higher oil prices due to the fighting in Yemen, the positive data are likely to keep NOK supported.
In the US, the 3rd estimate of the Q4 GDP is expected to show that the US economy expanded at a faster pace than the 2nd estimate. The 3rd estimate of the core personal consumption index, the Fed’s favorite inflation measure is also coming out. A strong reading could strengthen USD. The final University of Michigan consumer sentiment for March are coming out along with the surveys of 1-year and 5-to-10 year inflation expectations.
Four central bank governors and one Vice Chair speak Friday: Bank of England Governor Mark Carney, Fed Vice Chair Stanley Fischer, Riksbank Governor Stefan Ingves, Norges Bank Governor Oeystein Olsen and Fed Chair Janet Yellen. Yellen Is speaking on monetary policy at a San Francisco Fed conference entitled, “The New Normal for Monetary Policy.” She will also take questions from the audience.
EUR/USD pulls back to test the uptrend line
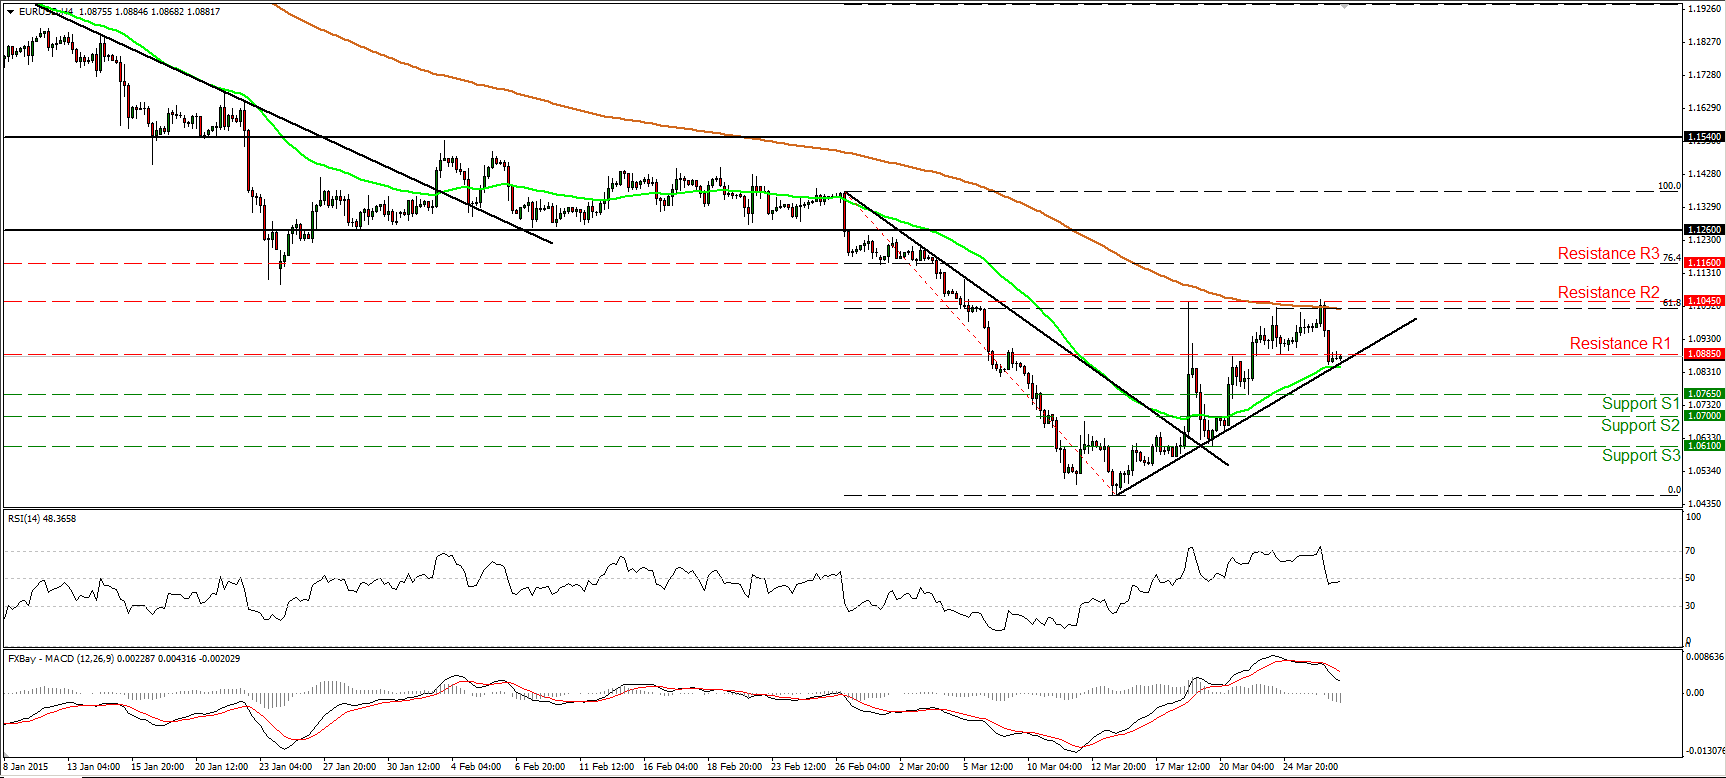
EUR/USD fell sharply after hitting once again resistance near the 1.1045 (R2) barrier and the 61.8% retracement level of the 26th of February – 16th of March decline, which happens to coincide with the 200-period moving average. The decline was halted by the 50-period moving average and the short-term uptrend line taken from the low of the 13th of March. The rate still stands above that line and above the downtrend line drawn from the peak of the 26th of February, therefore I still see a cautiously positive short-term picture. A move back above 1.0885 (R1), would confirm my view and perhaps pull the trigger for another test near the 1.1045 (R2) hurdle and the 61.8% retracement level.
As for the broader trend, the price structure still suggests a longer-term downtrend. EUR/USD is printing lower peaks and lower troughs below both the 50- and the 200-day moving averages. Therefore, I would treat the near-term uptrend or any possible extensions of it as corrective move of the larger down path.
• Support: 1.0765 (S1), 1.0700 (S2), 1.0610 (S3).
• Resistance: 1.0885 (R1), 1.1045 (R2), 1.1160 (R3).
GBP/JPY looks ready to go for the 176.00 barrier
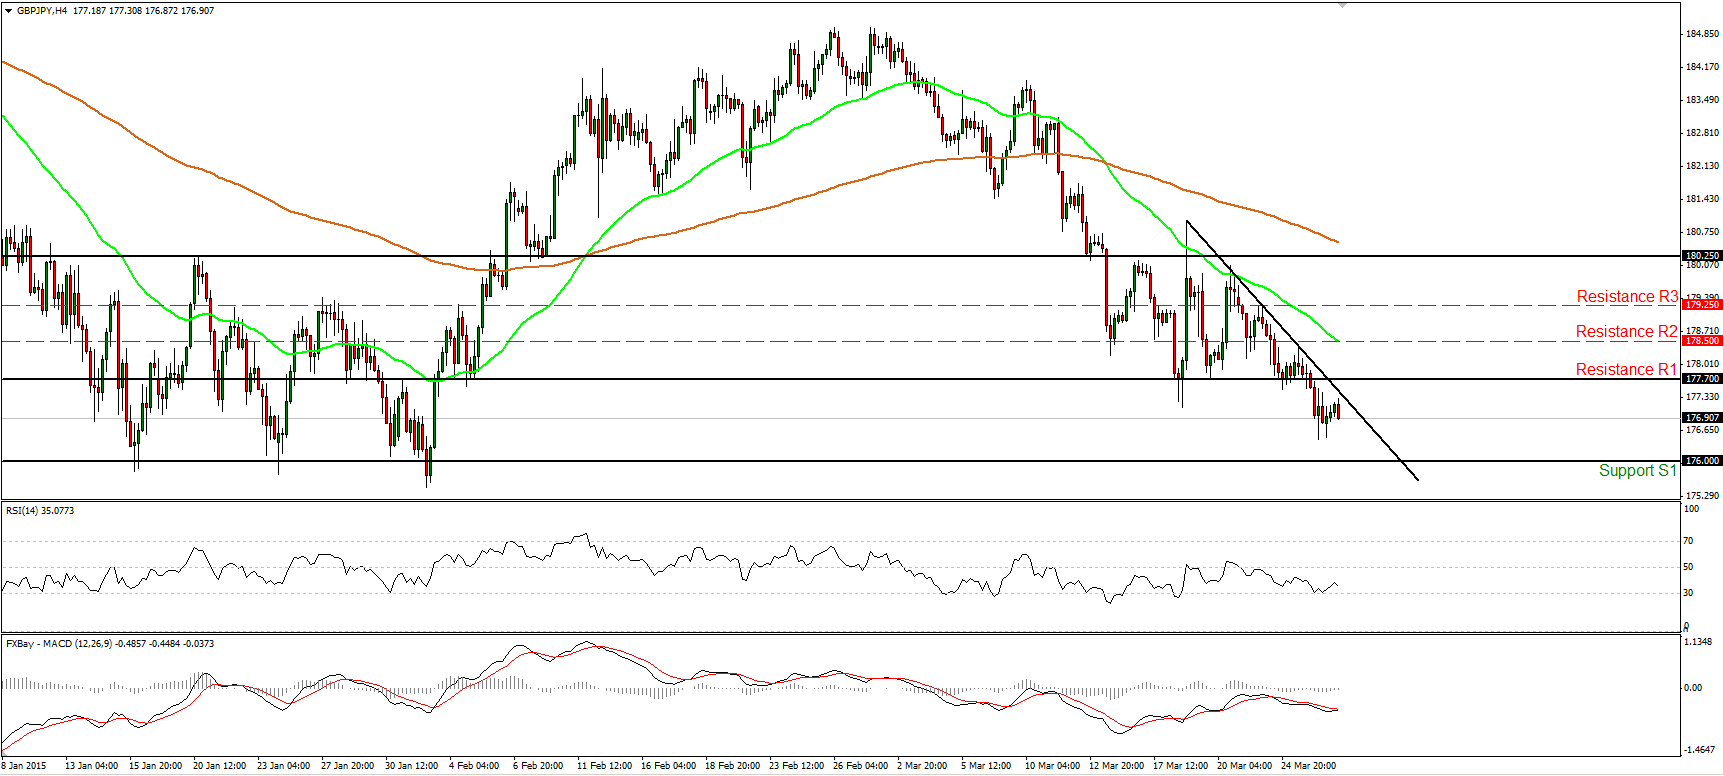
GBP/JPY fell below the lower line of the consolidation range that had been containing the price action since the 13th of March and turned the short-term bias back to the downside, in my view. I would now expect sellers to continue pushing the rate lower and target the strong support zone of 176.00 (S1). Our daily momentum studies detect negative momentum and amplify the case for such a move. The 14-day RSI stand below its 50 line and continues lower, while the MACD, lies below both its zero and signal lines, pointing south. As for the bigger picture, the rate fell below the 200-day moving average, while a decisive dip below 176.00 could complete a 5-month failure swing top and perhaps turn the overall outlook negative.
• Support: 176.00 (S1), 175.00 (S2), 174.00 (S3).
• Resistance: 177.70 (R1), 178.50 (R2), 179.25 (R3).
AUD/USD trades near the moving averages
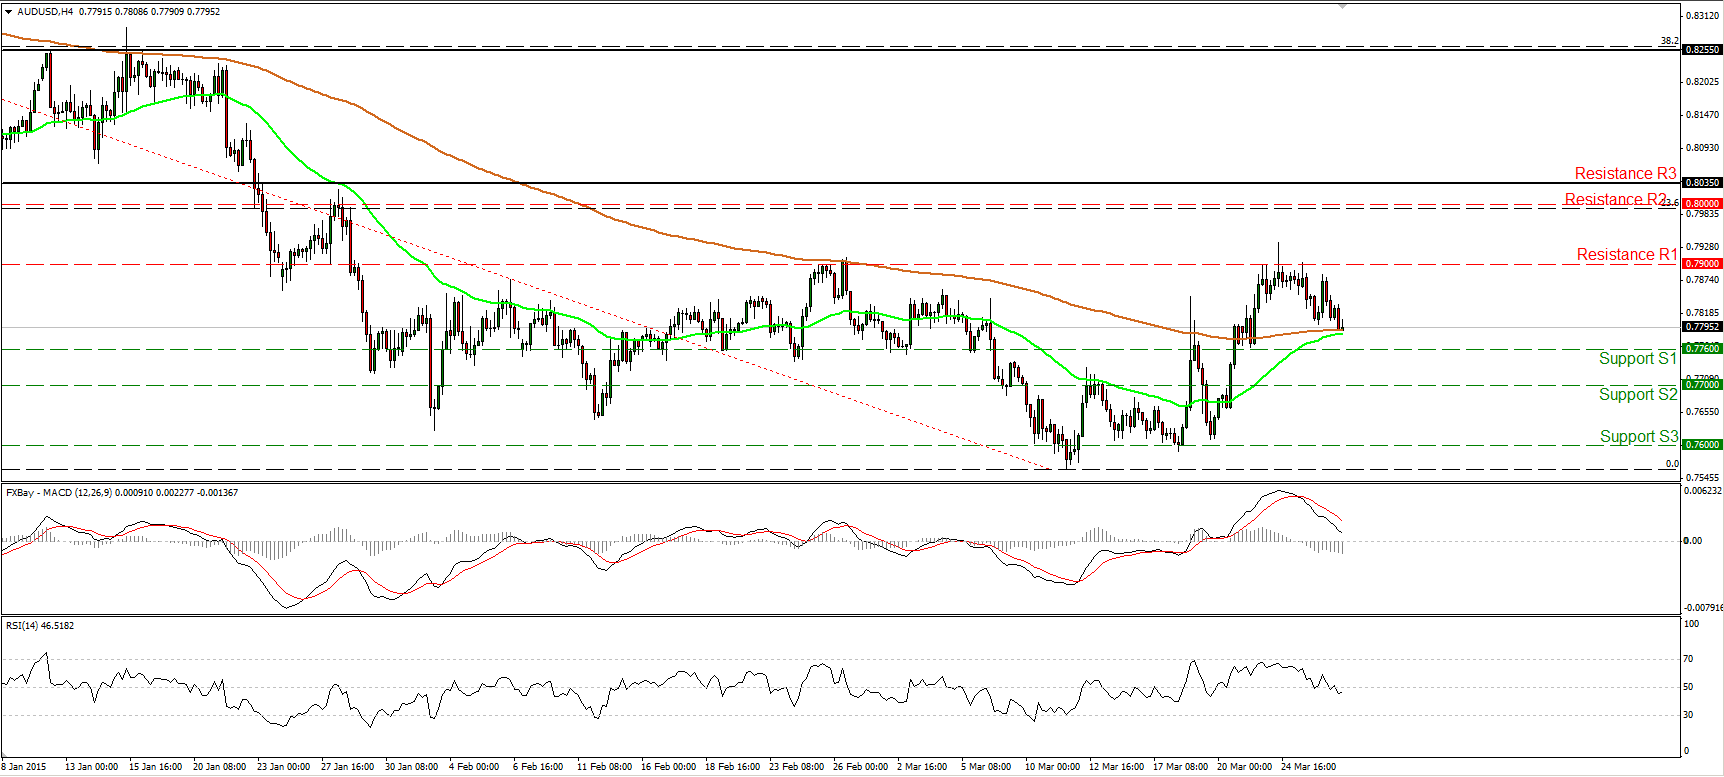
AUD/USD moved lower to meet both the 50- and the 200-period moving averages. Our short-term momentum studies reveal negative momentum, but personally I would like to see a dip below 0.7760 (S1) before getting confident on the downside. For now, I prefer to sit on the sidelines. In the case of a move below 0.7760 (S1), we will have a lower low on the 4-hour chart and we may see extensions towards the 0.7700 (S2) line.
As for the bigger picture, the rate is still trading above the downtrend line taken from back the peak of the 5th of September, confirming the positive divergence between our daily oscillators and the price action. This is another reason I would hold a neutral stance for now. I would like to wait for clearer directional signals.
• Support: 0.7760 (S1), 0.7700 (S2), 0.7600 (S3).
• Resistance: 0.7900 (R1), 0.8000 (R2), 0.8035 (R3).
Gold breaks above 1200
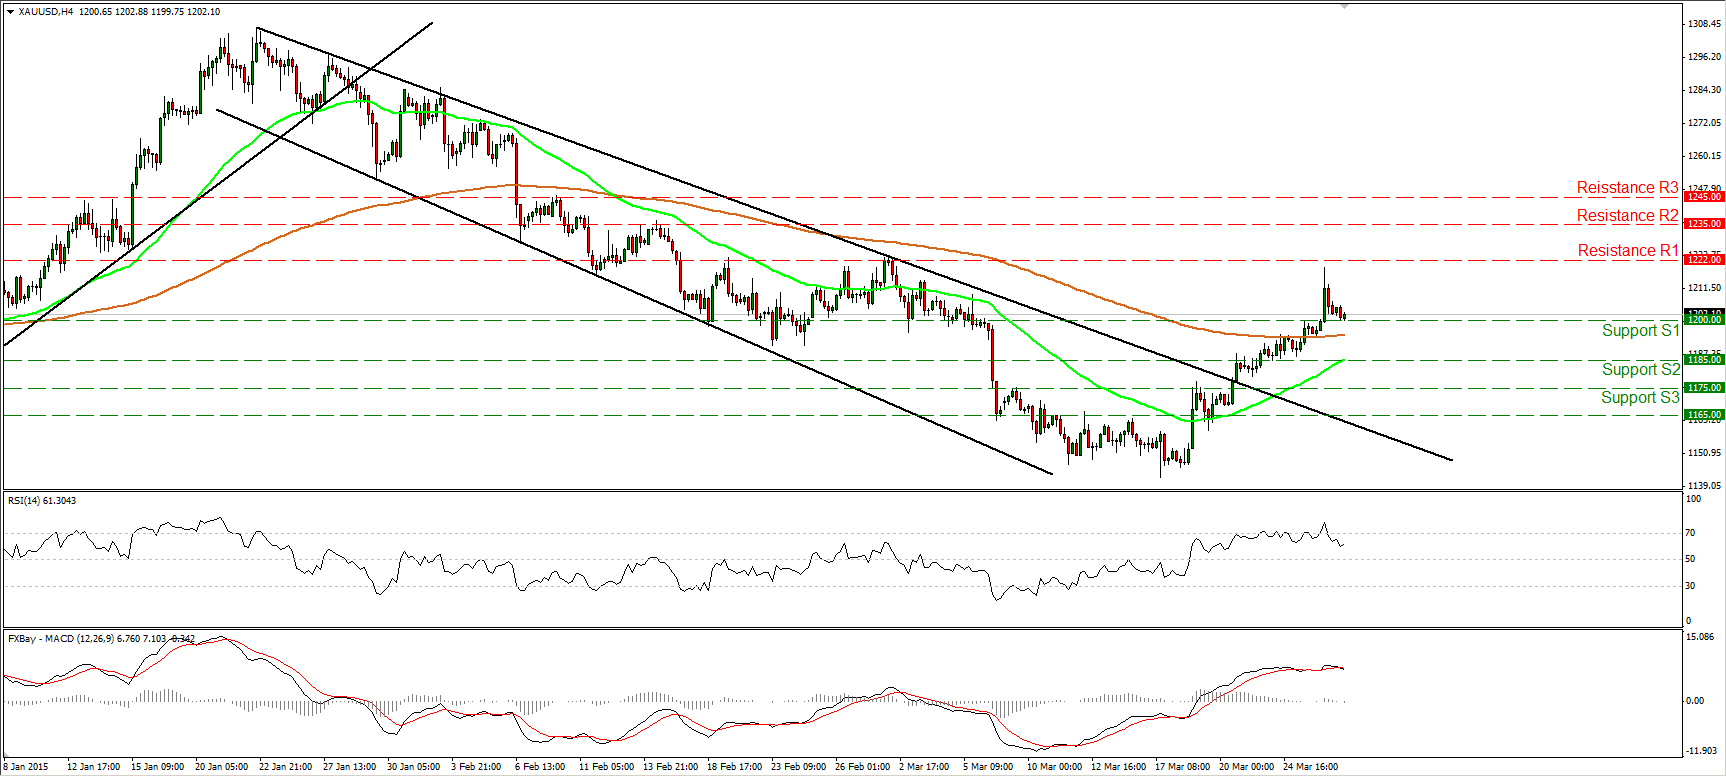
Gold surged on Thursday, breaking above the psychological figure of 1200 (S1). Subsequently, the metal found resistance marginally below our 1222 (R1) hurdle and pulled back to challenge the 1200 (S1) as a support this time. The short-term outlook remains positive and I would expect the bulls to seize control again and set the stage for a test at the 1222 (R1) line. Our daily oscillators support the near-term picture. The 14-day RSI continued to race higher and moved above its 50 line, while the daily MACD, already above its trigger, points up and is getting closer to its zero line.
As for the bigger picture, since the peak at 1307, the price structure has been lower highs and lower lows. However, yesterday’s rally almost reached the prior peak of the downtrend. I would switch my stance to neutral as far the longer-term trend is concerned.
• Support: 1200 (S1), 1185 (S2), 1175 (S3).
• Resistance: 1222 (R1), 1235 (R2), 1245 (R3).
WTI hits 52.45 and turns down
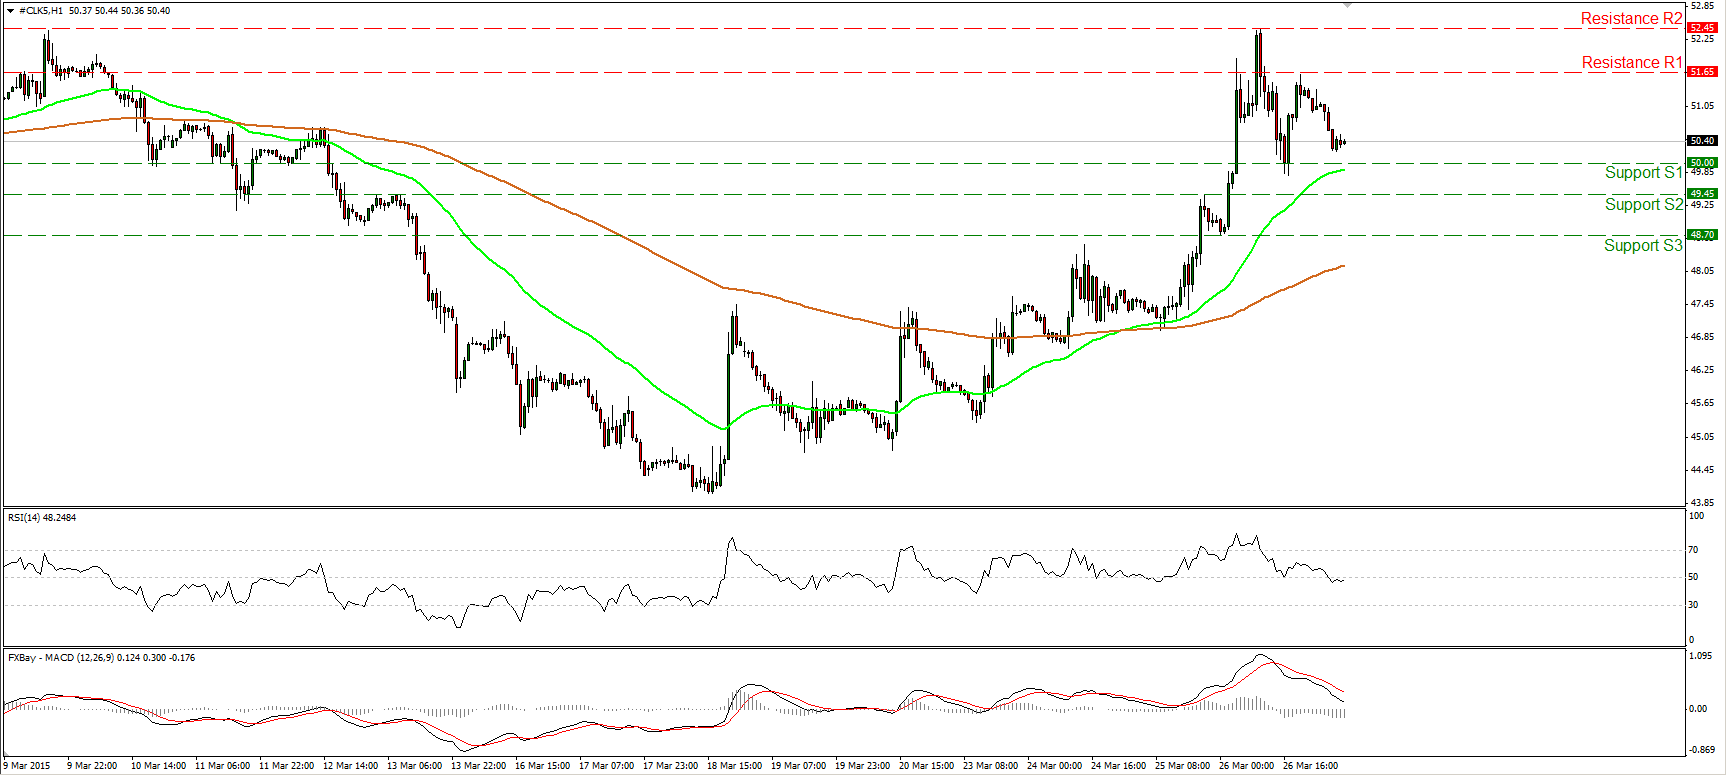
WTI continued its surge during the European morning Thursday and managed to hit our resistance line of 52.45 (R2) before turning down. The price now seems to be forming a failure swing top formation, thus I believe that the picture on the 1-hour chart has turned neutral. I would like to see a clear move below the psychological barrier of 50.00 (S1) before getting confident on the downside. Such a move would signal the completion of the failure swing and would confirm a forthcoming lower low. Our short-term momentum studies support the notion. The RSI slid below its 50 line, while the MACD, although positive, stands below its trigger, points down, and is headed towards its zero line. On the daily chart, WTI is trading well below the 200-day moving average, but traded for a while above the 50-day one. Moreover, there is still positive divergence between the daily oscillators and the price action. Therefore, I would prefer to stay neutral on the larger trend as well and wait for clearer directional signals.
• Support: 50.00 (S1), 49.45 (S2), 48.70 (S3).
• Resistance: 51.65 (R1) 52.45 (R2), 53.40 (R3).