WTI spikes on reports Iran will attend output-freeze talks | 24/08/16
• WTI spikes on reports Iran will attend output-freeze talks Oil prices surged on Tuesday, erasing recent losses and perhaps resuming this month’s uptrend. The spike was the result of reports that Iran will attend OPEC and non-OPEC talks on oil production in September, boosting expectations that an agreement to freeze output may be on the cards. Considering oil’s spectacular rally over the past weeks in anticipation of an agreement, we believe that prices could remain supported or even rise further over the coming month as speculation for a deal heightens. However, we would be hesitant to trust that these talks will actually bear fruit. Let’s not forget that a freeze was rejected in Doha at a period when prices were trading much lower, suggesting that it’s far more unlikely that producers will strike an agreement now. Furthermore, we remain skeptical of how meaningful a freeze would be at current output levels given that major producers including Saudi Arabia, Russia, Iran and Iraq, are operating around maximum production capacity. This implies that even if a consensus is reached, the market is likely to continue to be over flooded with supply for some time.
• Most regional Fed banks voted for raising the discount rate Eight out of the twelve regional Fed Banks supported an increase in the rate charged on direct loans from the Fed, according to the minutes from the July discount rate meeting. The discount rate is the interest rate charged to banks and depository institutions for loans received from the Fed’s lending facility, and is separate from the Federal funds rate, the Fed’s main policy tool. The Board of Governors, which must approve any change in the discount rate, rejected the proposition. Nevertheless, this suggests that there may be a growing consensus for a near-term rate hike among regional Fed Bank boards and perhaps their respective presidents, who are members of the FOMC. The probability for a September hike jumped to 21% today from 15% yesterday, supported also by the astonishing surge in new home sales for July. Moving forward, markets are likely to remain focused on Fed Chair Yellen’s speech on Friday. Any comments she makes with regards to the near-term rate outlook are likely to determine the dollar’s short-term direction.
• Today’s highlights: During the European day, Germany’s final estimate of Q2 GDP is due out and expectations are for the figure to confirm its preliminary reading.
• From Norway, we get the oil investment survey for Q3, but no forecast is available. Bearing in mind that the oil and gas sector constitutes approximately 25% of Norway’s GDP, this indicator is closely tracked by investors. We also get the nation’s AKU unemployment rate for June and expectations are for the rate to have remained unchanged.
• From the US, we get existing home sales for July and the forecast is for a decline, albeit a marginal one. However, we do not believe that such a minor decline would point to a deterioration in the housing market, considering that new home sales surged by 12.4% in July, against expectations of a 2.0% decline. This suggests that more people are willing and able to buy new houses instead of existing ones, something indicative of a strengthening economy and also in line with the steady improvement in the labor market.
• We have no speakers scheduled for today.
EUR/USD hits 1.1335 again and retreats
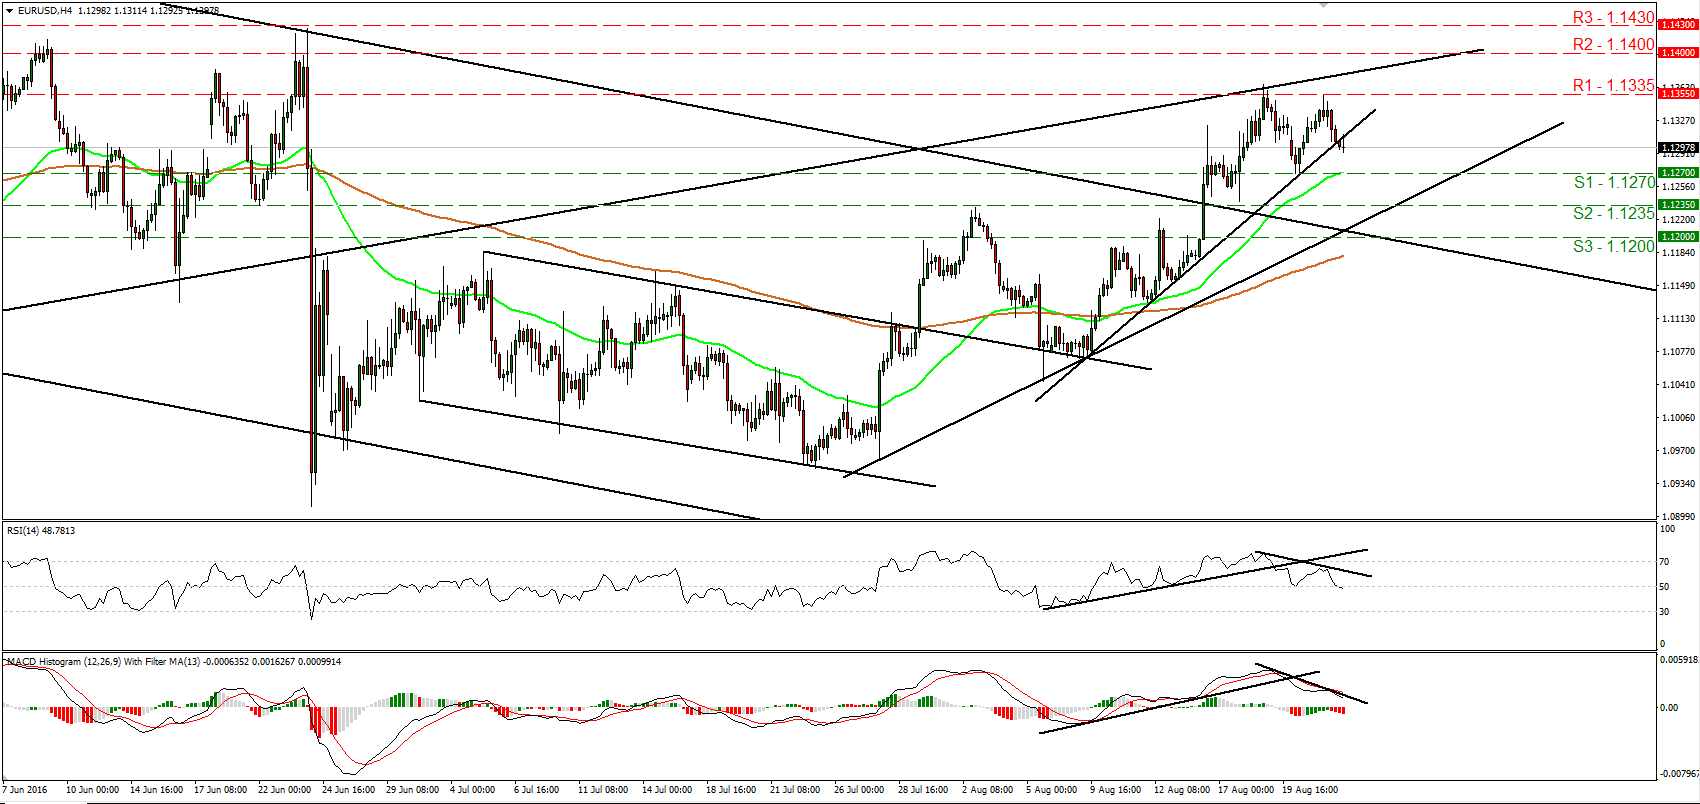
• EUR/USD traded lower on Tuesday after it hit resistance once again at the 1.1335 (R1) hurdle. The rate fell below the upside support line taken from the low of the 9th of August, which combined with the fact that the bulls failed to overcome the 1.1335 (R1) zone and confirm a forthcoming higher high turns the short-term outlook cautiously to the downside in my view. A break below 1.1270 (S1) could signal the completion of a short-term double top formation and may initially set the stage for extensions towards our next support zone of 1.1235 (S2). Further declines are also supported by our momentum studies. The RSI turned down and just fell below 50, while the MACD, although positive, stands below its trigger line and points down. What’s more, there is negative divergence between both these indicators and the price action. As for the bigger picture, as long as the pair is trading within the sideways range between 1.0800 and 1.1500, I would maintain my flat stance as far as the longer-term trend is concerned.
• Support: 1.1270 (S1), 1.1235 (S2), 1.1200 (S3)
• Resistance: 1.1335 (R1), 1.1400 (R2), 1.1430 (R3)
USD/JPY rebounds from 100
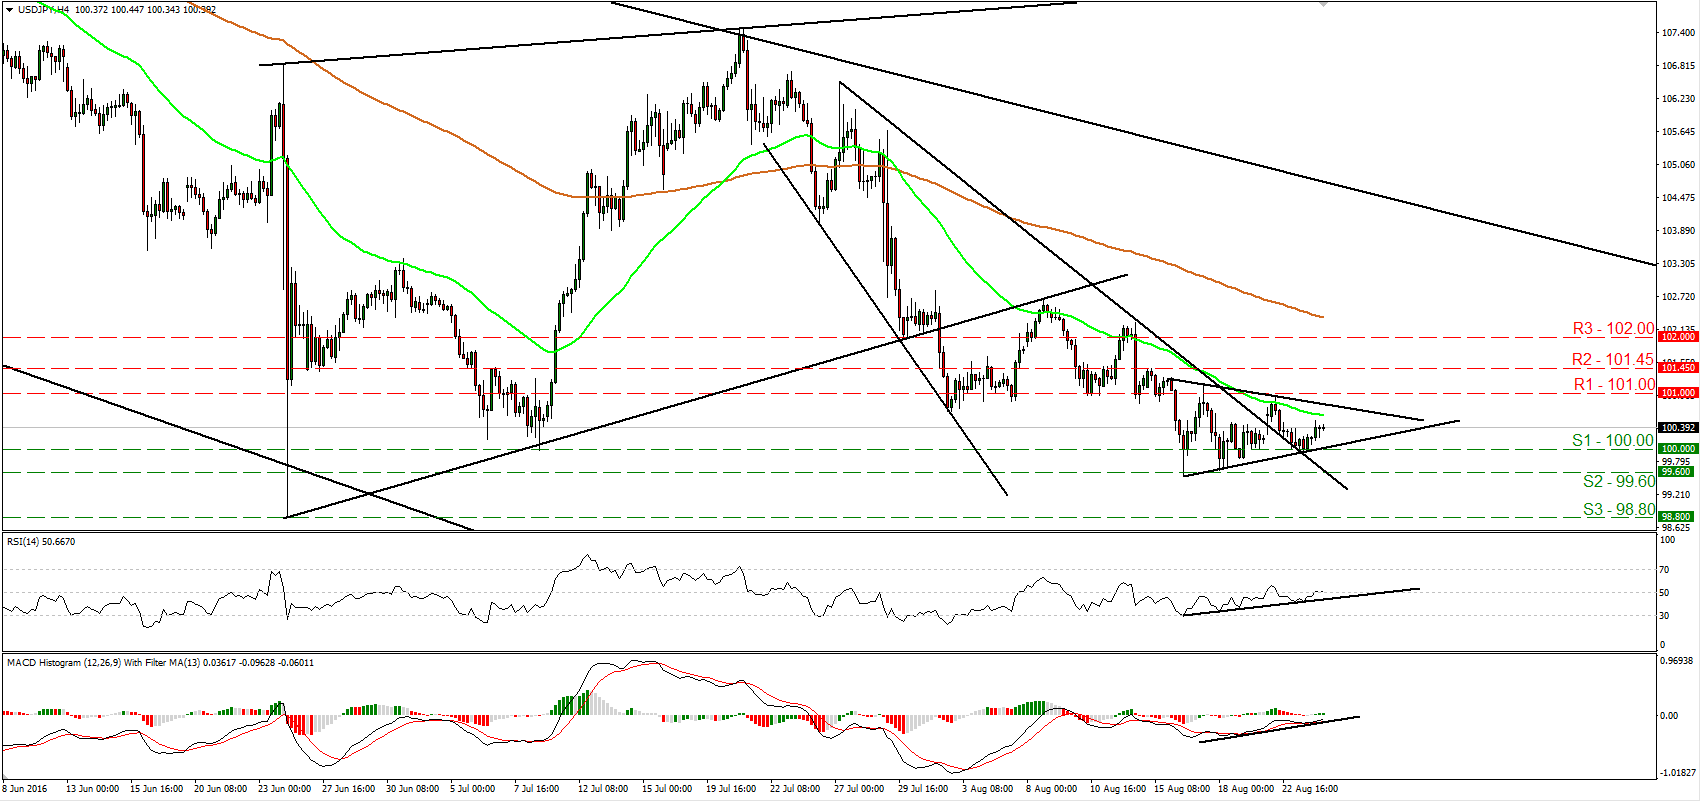
• USD/JPY traded somewhat higher yesterday after it hit support at the psychological round level of 100.00 (S1). The rate looks to be trading within a short-term triangle formation since the 15th of August and as a result, I would consider the short-term picture to be neutral for now. I would like to see a clear exit out of the pattern before I arrive to any conclusions with regards to the next short-term directional path. A break above 101.00 (R1) would confirm the upside exit and perhaps bring a short-term trend reversal. On the other hand, a clear dip below 100.00 (S1) is the move that could bring the resumption of the prevailing downtrend. As for the bigger picture, I still see a longer-term downtrend. However, given the recent consolidation, I prefer to maintain a “wait and see” stance for now with regards to the broader trend as well.
• Support: 100.00 (S1), 99.60 (S2), 98.80 (S3)
• Resistance: 101.00 (R1), 101.45 (R2), 102.00 (R3)
EUR/GBP falls below 0.8580
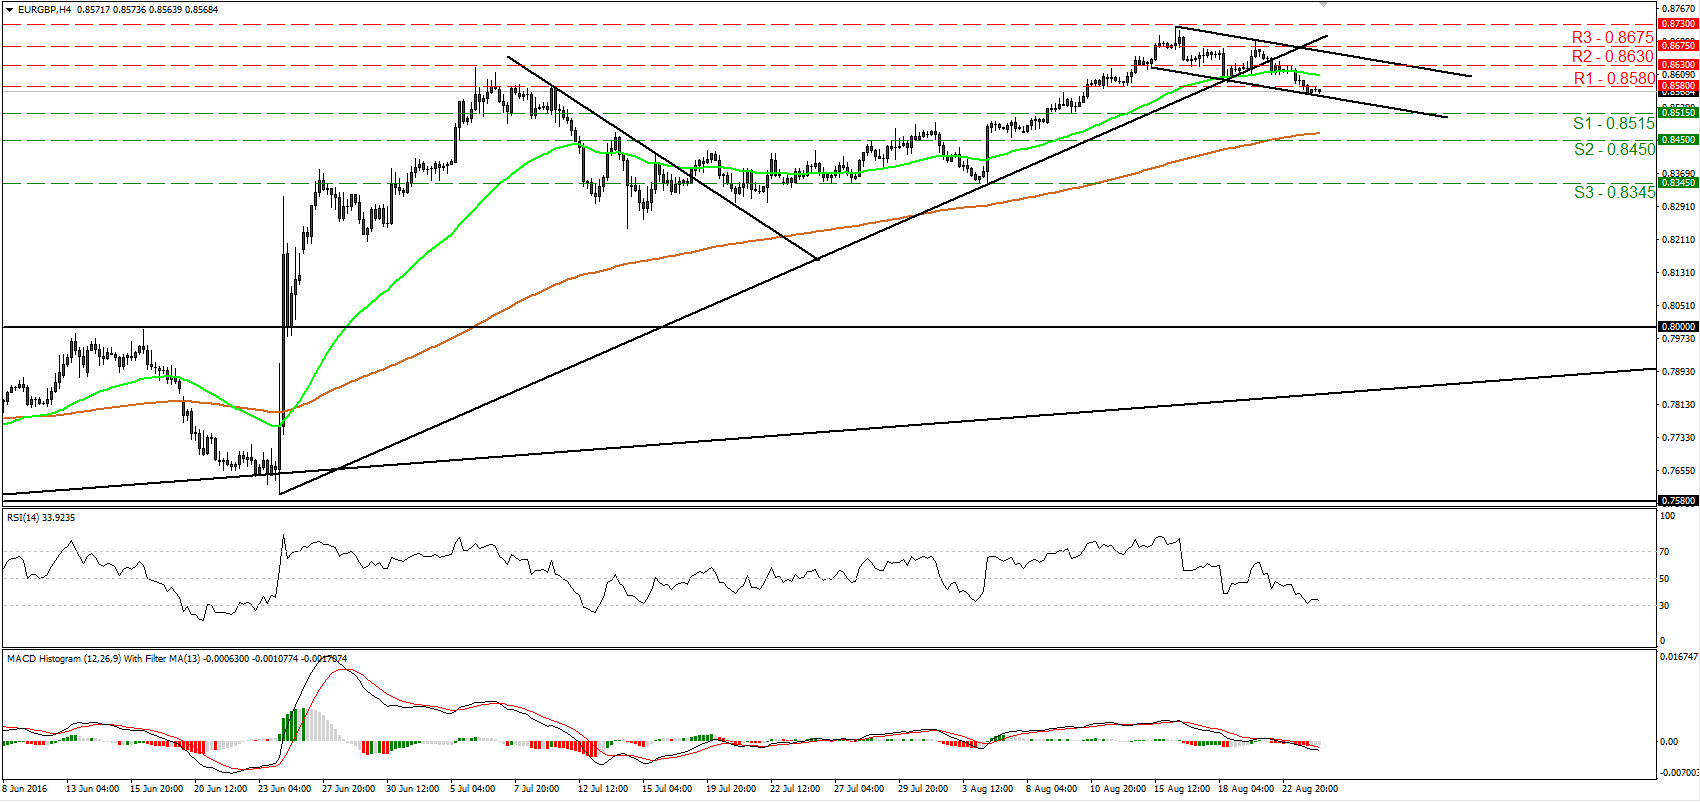
• EUR/GBP traded lower on Tuesday, breaking below the support (now turned into resistance) barrier of 0.8580 (R1). Nevertheless, the decline was stopped by the lower bound of a short-term downside channel that has been containing the price action since the 16th of August. Given that the rate is trading within that channel and below the upside support line taken from the low of the 24th of June, I would consider the short-term outlook to be negative. Nevertheless, taking into account the test near the lower bound of the channel, I would be mindful that a corrective bounce may be on the cards before the next negative leg. Such a rebound is also supported by our momentum studies. The RSI hit support near its 30 line and turned up, while the MACD, although negative, shows signs that it could start bottoming. Zooming out to the daily chart, I still see a longer-term uptrend. Nevertheless, I also see negative divergence between both our daily oscillators and the price action, something that increases the odds for the short-term downtrend to continue for a while.
• Support: 0.8515 (S1), 0.8450 (S2), 0.8345 (S3)
• Resistance: 0.8580 (R1), 0.8630 (R2), 0.8675 (R3)
Gold turns down after hitting the prior upside support line
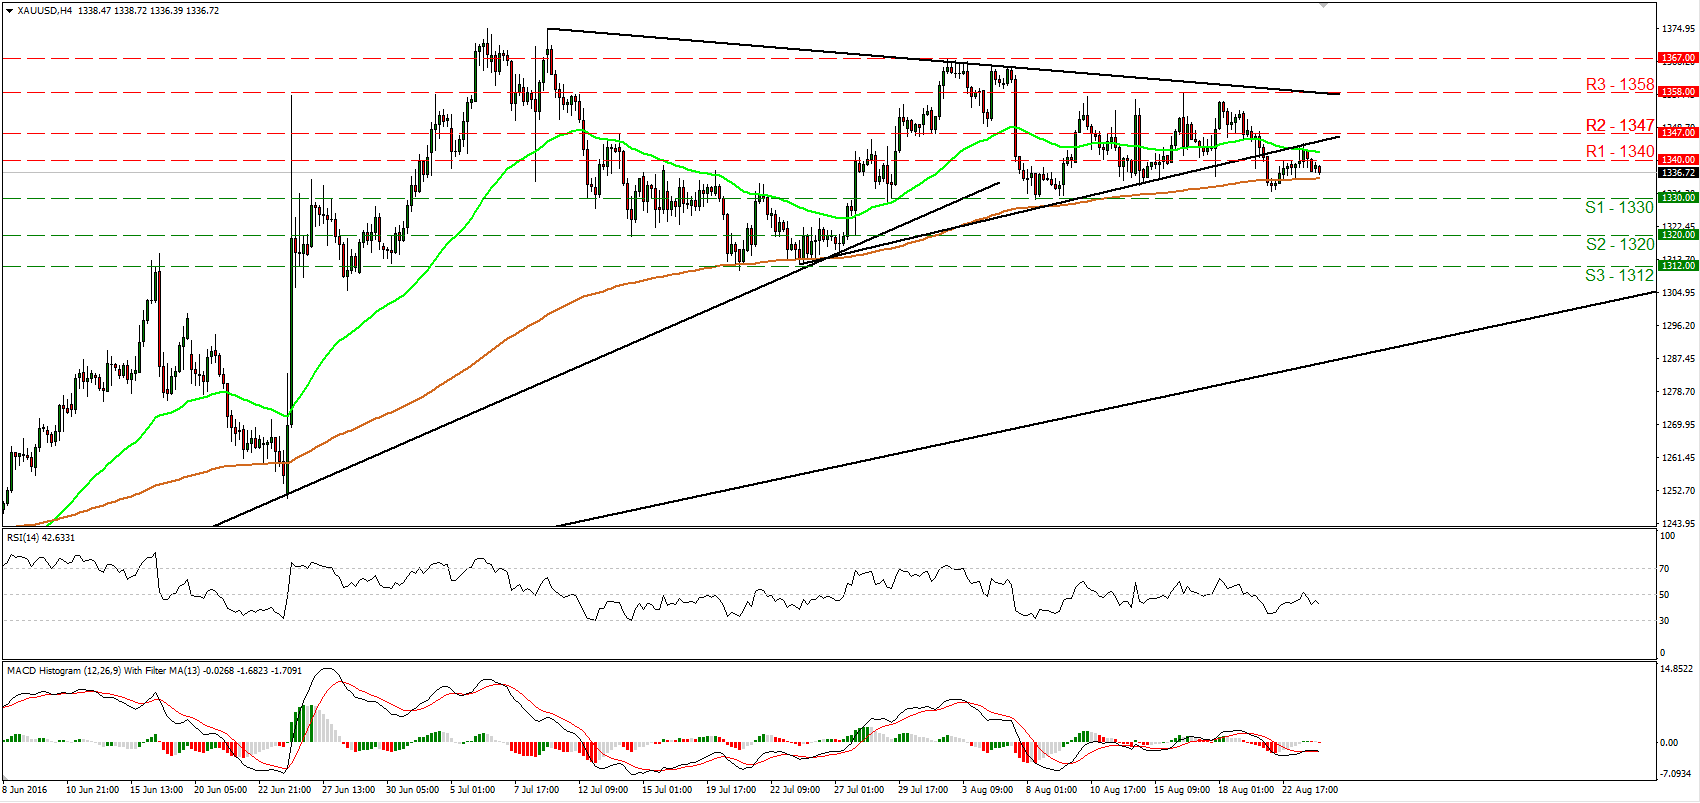
• Gold traded somewhat lower on Tuesday after it hit resistance at the prior upside support line taken from the low of the 25th of July. In my opinion, the fact that the metal remains below that line keeps the short-term outlook cautiously negative. A clear break below the support zone of 1330 (S1) could confirm a forthcoming lower low and is possible to open the way for our next hurdle of 1320 (S2). Shifting my attention to our short-term oscillators, I see that the RSI hit resistance slightly above 50 and turned down again, while the MACD lies within its negative territory and appears ready to cross back below its trigger line. These indicators detect negative momentum and amplify the case for further declines. Switching to the daily chart, I see that the metal is trading above the uptrend line taken from back at the low of the 17th of December. In my view, this keeps the longer-term picture positive, but given that since the 11th of July we have a structure of lower peaks, I prefer to take the sidelines for now with regards to the broader picture.
• Support: 1330 (S1), 1320 (S2), 1312 (S3)
• Resistance: 1340 (R1), 1347 (R2), 1358 (R3)
WTI spikes higher on Iran talk
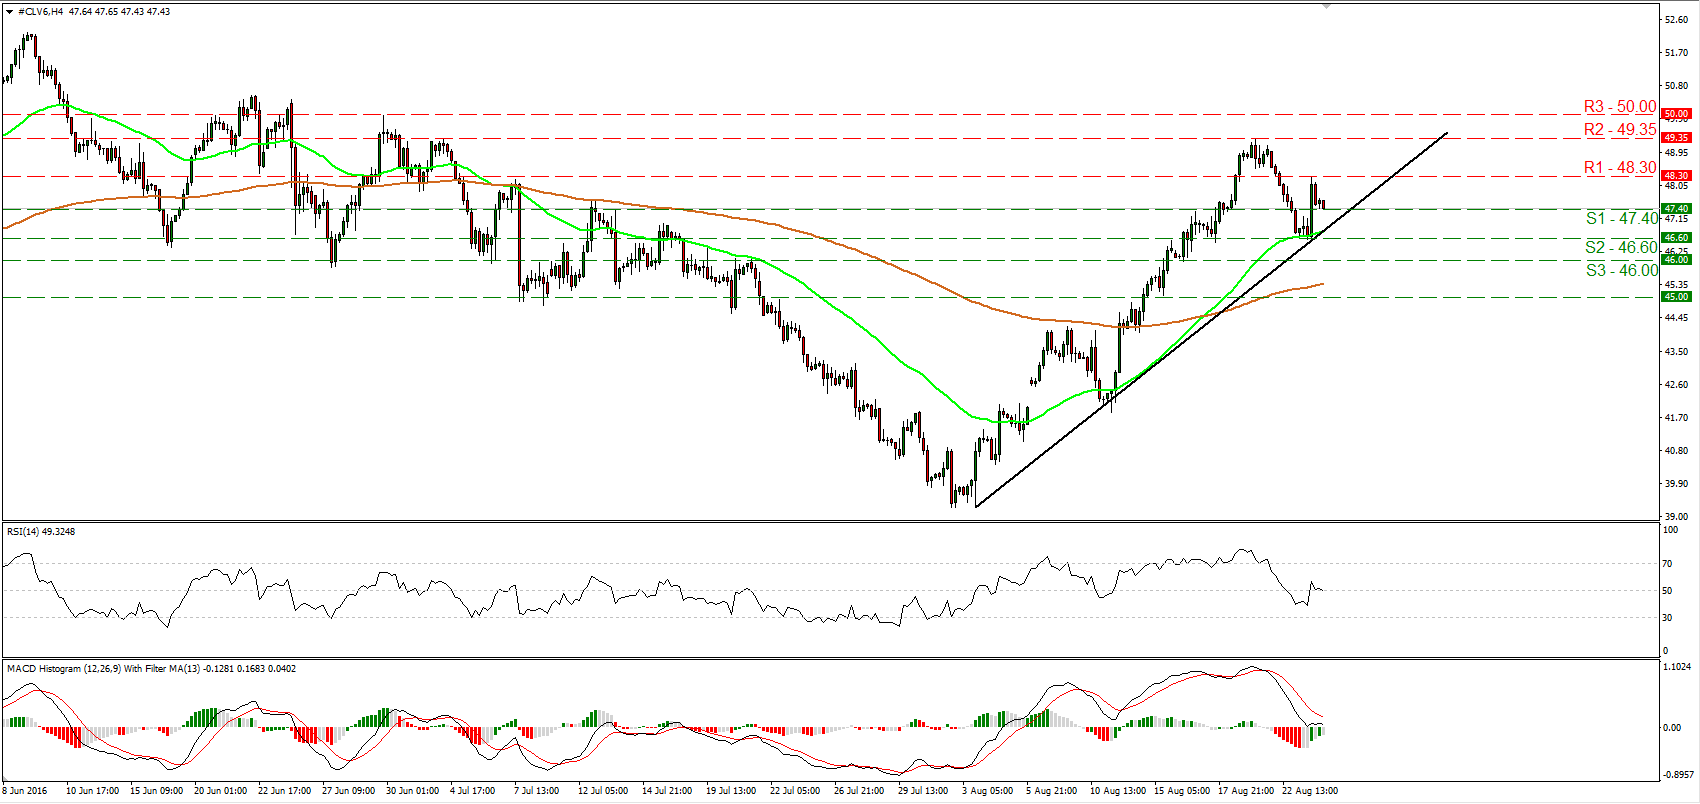
• WTI spiked higher on Tuesday following a report that Iran may support an output-freeze decision. The price edged north after hitting the short-term uptrend line taken from the low of the 3rd of August to hit resistance at 48.30 (R1). Then, the price retreated again. As long as WTI is trading above that uptrend line, I would consider the short-term picture to stay positive. If the bulls take control at some point and manage to break above 48.30 (R1), I would expect them to target again the 49.35 (R2) zone, marked by the peak of the 19th of August. However, for now I see the likelihood for the current retreat to continue a bit more. This is evident by our short-term oscillators. The RSI has just touched its toe back below its 50 line, while the MACD, already below its trigger line, appears ready to turn negative. Zooming out to the daily chart, I see that oil’s recovery started on the 3rd of August after the price hit support slightly below the 50% retracement level of the 20th of January – 9th of June uptrend. What is more, on the 12th of August, WTI broke above the psychological 45.00 zone and the downtrend line taken from the peak of the 29th of June. All these make me believe that the medium-term outlook has turned back to the upside and enhance the case for the bulls to take charge again at some point soon.
• Support: 47.40 (S1), 46.60 (S2), 46.00 (S3)
• Resistance: 48.30 (R1), 49.35 (R2), 50.00 (R3)