IronFX Daily Commentary | 22/04/15
Greek problems continue to pressure EUR The Greek drama continues. Now the talk is that the ECB is getting worried about the solvency of the Greek banks, as I mentioned yesterday, and may increase the collateral haircut for the banks. The total collateral that Greek banks have submitted in order to get Emergency Liquidity Assistance (ELA) from the ECB is estimated at around EUR 140bn. The total ELA financing is estimated at EUR 74bn, so this implies a haircut of around 50% already. Assuming they raise this to 75%, it would mean the Greek banks need another EUR 35bn in collateral. It’s unclear (to me at least) if they have this much extra collateral available. Some sources say that they can. Without it, it’s also unclear to me how they would deal with any further withdrawals of funds from the banking system. Bloomberg reported that the Bank of Greece keeps a buffer of some EUR 3bn in ELA funds in reserve, but with Greek residents pulling around EUR 8bn a month out of the banking system, that wouldn’t last for long. Greek PM Tsipras will meet with German Chancellor Merkel Thursday in Brussels in an effort to secure a statement of political support from Berlin. Good luck!
As the Greek endgame approaches, it is clearly weighing on the currency. EUR/USD recently has been hitting its daily lows during London trading hours and then hitting its daily high during US trading hours, as the market in Europe reacts to headlines about Greece and then US traders play the daily range.
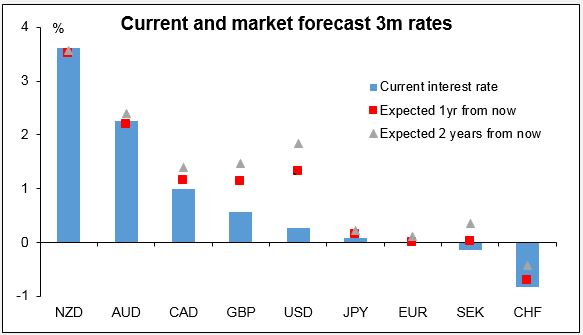
Negative EUR rates The 3-month EURIBOR rate went negative for the first time yesterday, meaning banks are paying each other to take money off their hands. Paying another bank -0.01% is better than paying the ECB -0.2%, I guess. The EURIBOR futures see it remaining below zero until after the ECB’s QE operation ends in Sep. 2016. US rates on the other hand are seen increasing steadily. This monetary policy divergence is what’s driving the market and will continue to drive it, in my view.
Oil falls; look for weak CAD, NOK today Saudi Arabia ended its bombing in Yemen, which reduces tensions in the Middle East slightly, while the API reportedly said crude oil inventories rose 5.5mn barrels last week. Oil market participants expect today’s US government data on US crude oil inventories to show a rise of 3.2mn barrels. The combination sent oil prices sharply lower, particularly Brent. This is likely to weaken CAD and NOK today. Note though that Saudi Arabia also ordered the national guard to take part in the Yemen operation, so it clearly isn’t over – only the part that was attracting international criticism.
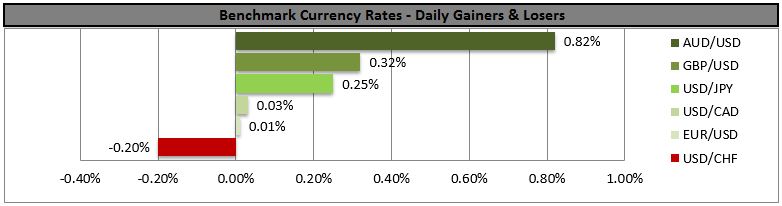
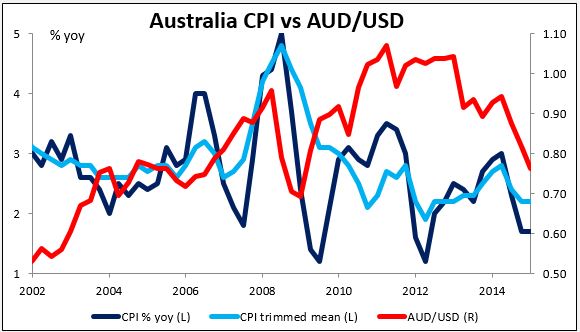
Australia inflation sends AUD/USD higher What’s Australia’s inflation rate? Do you want the CPI? The weighted median rate? The trimmed mean rate? The seasonally adjusted rate? Quarter-on-quarter change? Year-on-year change? With four different measures, each of which is released in two different ways, it’s hard to tell exactly what the market was looking at. Some measures were lower than expected and some showed a decline from the previous quarter, while others were higher than expected or showed an acceleration. From my point of view, the headline CPI, which is what the Reserve Bank of Australia targets, fell to 1.3% yoy from 1.7% yoy. This is way below the RBA’s target of 2%-3% and therefore should increase the likelihood of an easing. But the weighted median measure accelerated on both a qoq and yoy pace, and that must have been what caught the market’s eye, because AUD/USD popped about 40 pips on the news, in contrast to the lack of any major move on Monday when New Zealand CPI came out lower than expected. The market now places a 59% likelihood of a rate cut at the next meeting on May 5th, down from 68% yesterday. RBA Gov. Stevens Monday reminded us that further policy easing is “on the table,” so I would not dismiss the possibility entirely.
Today’s highlights: During the European day, the Bank of England releases the minutes of its latest policy meeting. It will be interesting to see if other MPC members besides the previously hawkish MPC member Ian McCafferty worry about the possible impact of the low inflation outlook on wage deals. In such an event, rate hike expectations could be pushed further back and GBP could weaken.
In the US, FHFA housing price index for February and existing home sales for March are due to be released. The housing starts and building permits released last week were consistent with a firming housing market. If the existing home sales are in line with a strong housing sector, this may be USD-supportive.
We have no speakers on Wednesday’s agenda.
EUR/USD breaks below the lower line of an upside channel
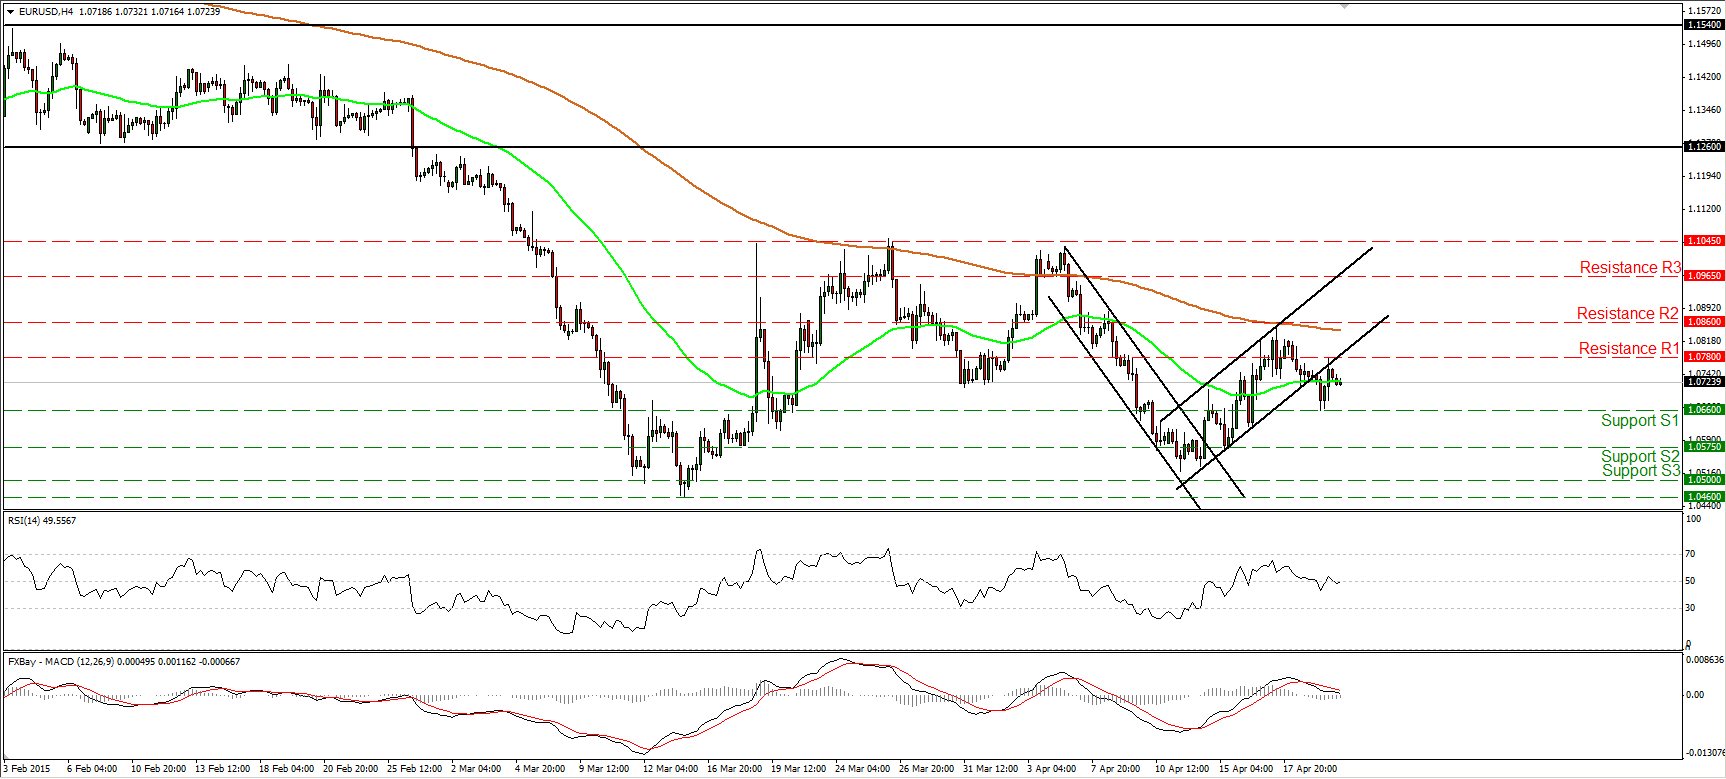
EUR/USD continued trading lower on Tuesday, falling below the lower line of the black upside channel. Nevertheless, the slide was halted at 1.0660 (S1) and then the rate rebounded to hit resistance at 1.0780 (R1). I will continue to stand on the side lines, since a break below 1.0660 (S1) is the move that would confirm a forthcoming lower low on the 4-hour chart and perhaps turn the short-term outlook negative. Such a move is likely to target our next support line of 1.0575 (S2). In the bigger picture, EUR/USD is still trading below both the 50- and the 200-day moving averages. However, a clear close below 1.0460 is needed to confirm a forthcoming lower low and trigger the resumption of the larger downtrend. On the other hand, a close above 1.1045 could signal the completion of a double bottom and perhaps set the stage for larger bullish extensions.
• Support: 1.0660 (S1), 1.0575 (S2), 1.0500 (S3).
• Resistance: 1.0780 (R1), 1.0860 (R2), 1.0965 (R3).
USD/CAD finds resistance near the 1.2300 obstacle
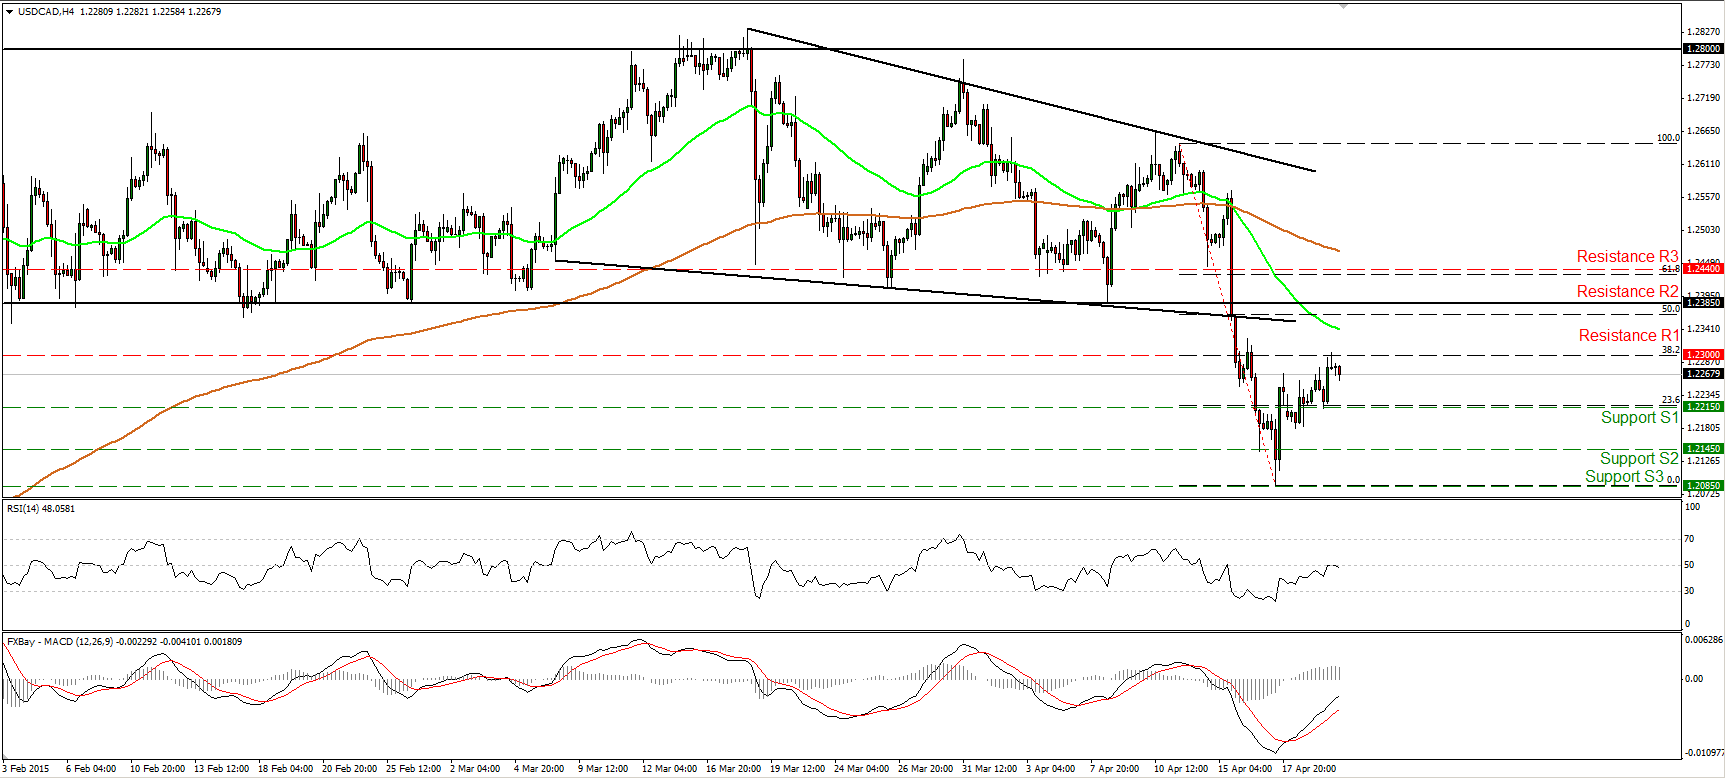
USD/CAD traded higher yesterday, but hit resistance near 1.2300 (R1), which happens to be the 38.2% retracement level of the 13th – 17th of April collapse. Then the pair slid somewhat. My opinion is that even if we experience further advances, I believe that the outlook for USD/CAD is somewhat negative. I would expect any further bullish extensions to stay limited below the 1.2385 (R2) key hurdle. A clear move below the 1.2215 (S1) barrier would confirm my view and perhaps pull the trigger for the next one at 1.2145 (S2). As for the broader trend, the downside violation of the 1.2385 (R2) key barrier confirmed the negative divergence between our daily oscillators and the price action, and turned the medium-term bias to the downside in my view. I believe that the recovery from 1.2085 (S3) is just a corrective move and that sellers will eventually take control again.
• Support: 1.2215 (S1), 1.2145 (S2), 1.2085 (S3).
• Resistance: 1.2300 (R1), 1.2385 (R2), 1.2440 (R3).
AUD/USD shoots up
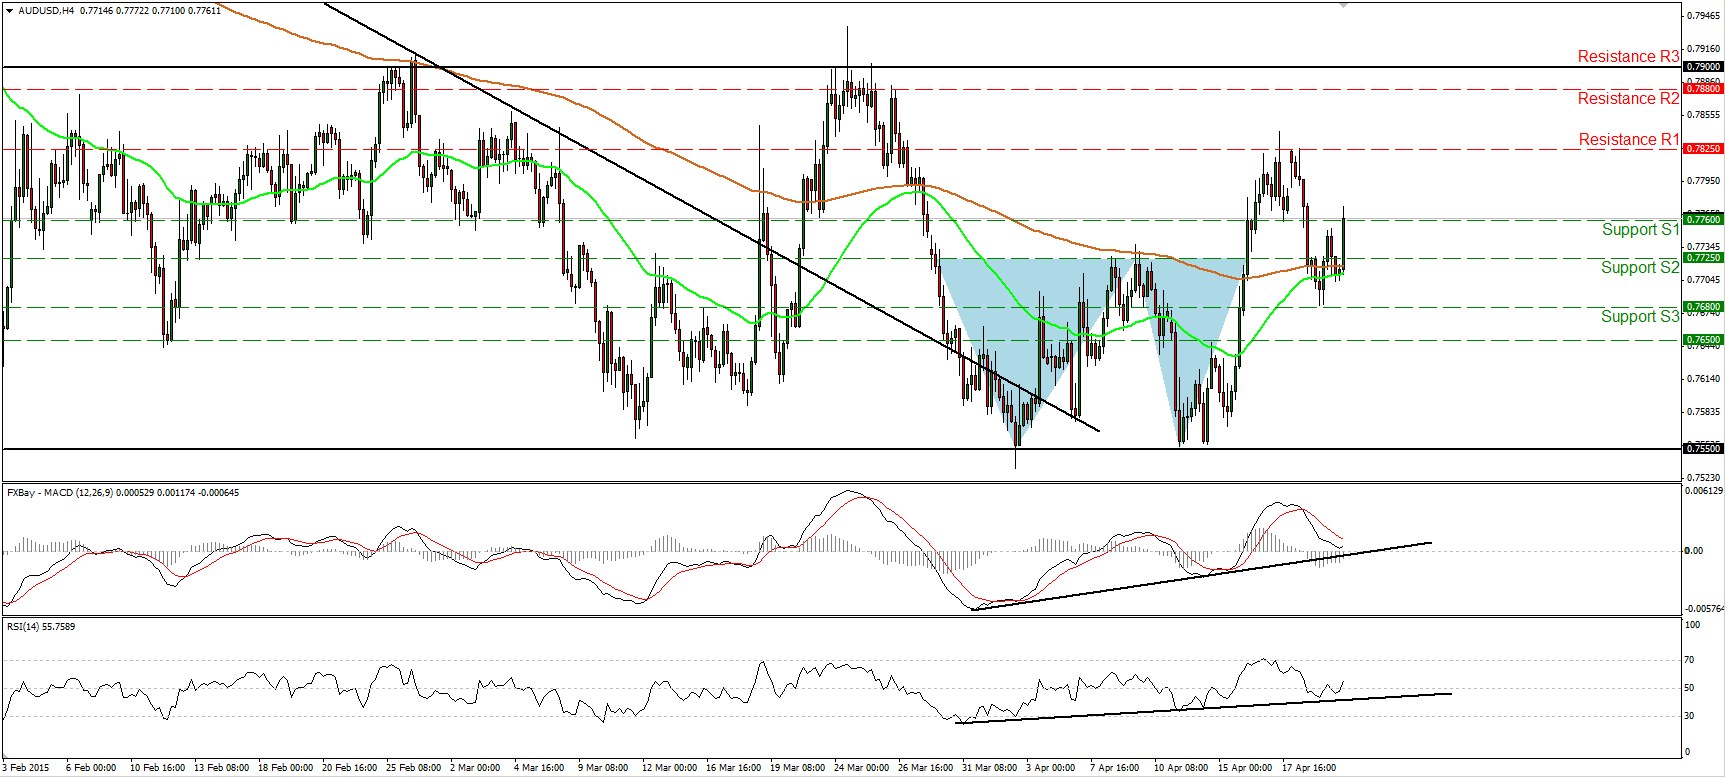
AUD/USD shot up during the Asian morning Wednesday after the release of the Australia CPI data and emerged above the resistance (now turned into support) line of 0.7760 (S1). That move keeps intact the double bottom completed upon the upside violation of 0.7725 (S2). Thereafter, I would see a cautiously positive near-term picture. I would expect the rate to continue higher and challenge the 0.7825 (R1) area. Our short-term oscillators corroborate my view. The RSI rebounded from its upside support line and edged above its 50 line, while the MACD, already positive, shows signs of bottoming and that it could move above its trigger soon. Although I believe we are likely to experience further upside extensions in the near term, I maintain my neutral view as far as the overall outlook is concerned. The rate is still trading between 0.7550 and 0.7900 since the end of January. There is also positive divergence between our daily momentum indicators and the price action.
• Support: 0.7760 (S1), 0.7725 (S2), 0.7680 (S3).
• Resistance: 0.7825 (R1), 0.7880 (R2), 0.7900 (R3).
Gold remains trendless
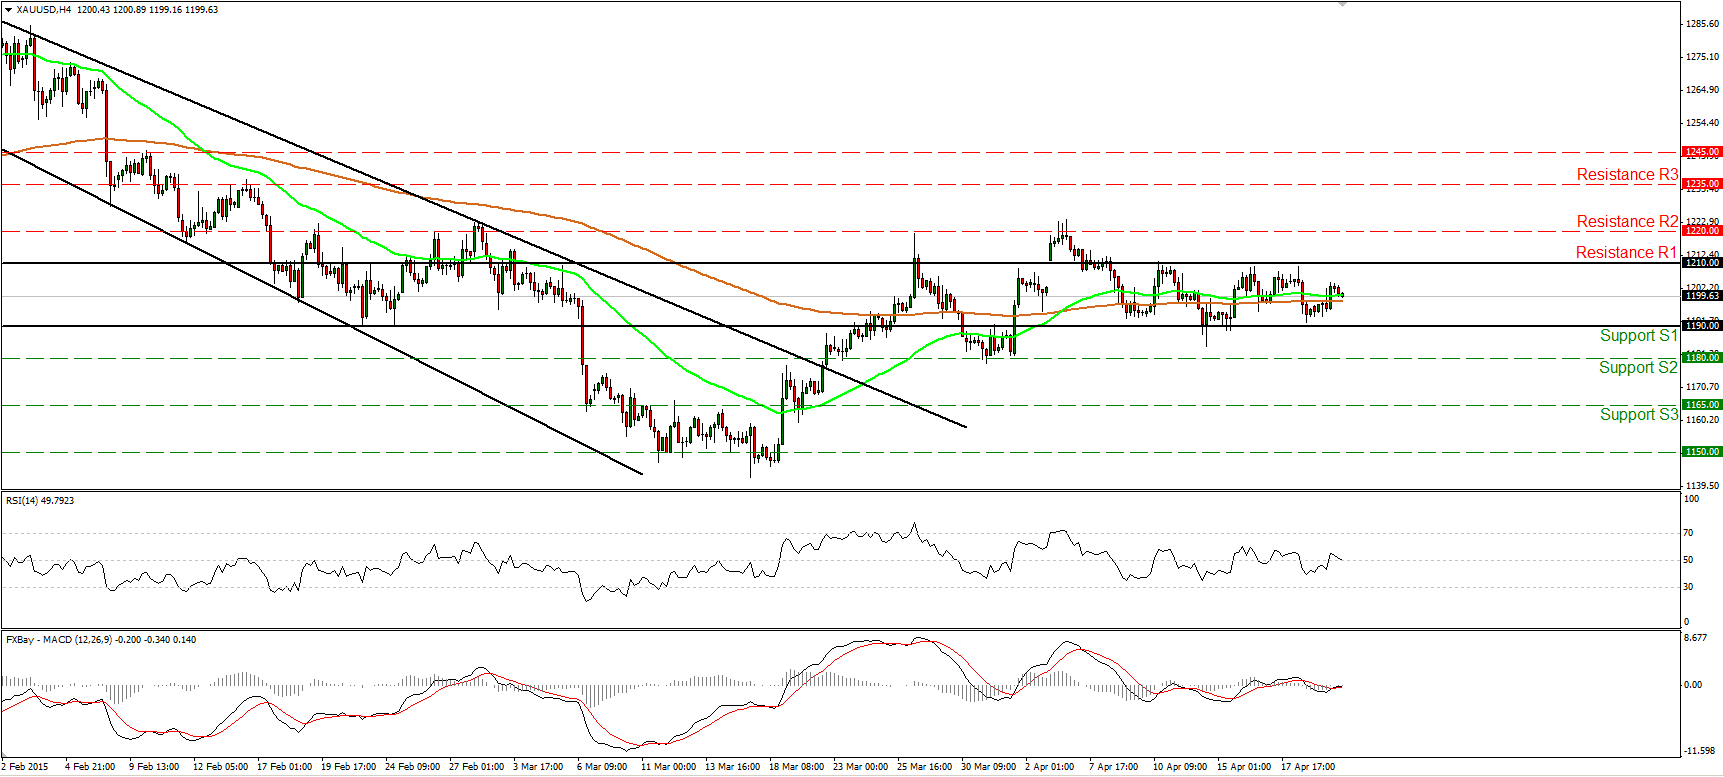
Gold traded higher on Tuesday after finding support marginally above the 1190 (S1) barrier. The precious metal stays between that hurdle and the resistance of 1210 (R1). Therefore, I would consider the short-term picture to be neutral for now. The 50- and 200-period moving averages both point east, supporting the notion. Our daily oscillators do so as well. They both oscillate around their equilibrium lines. A move below 1190 (S1) is needed to shift the bias back to the downside and perhaps trigger extensions towards our next support at 1180 (S2). As for the bigger picture, the price is still trading below the 50% retracement level of the 22nd of January - 17th of March decline. This still makes me believe that the 17th of March – 06th of April recovery was just a corrective move and that we will see gold trading lower in the not-too-distant future.
• Support: 1190 (S1), 1180 (S2), 1165 (S3).
• Resistance: 1210 (R1), 1220 (R2), 1235 (R3).
WTI hits support at 55.00 again
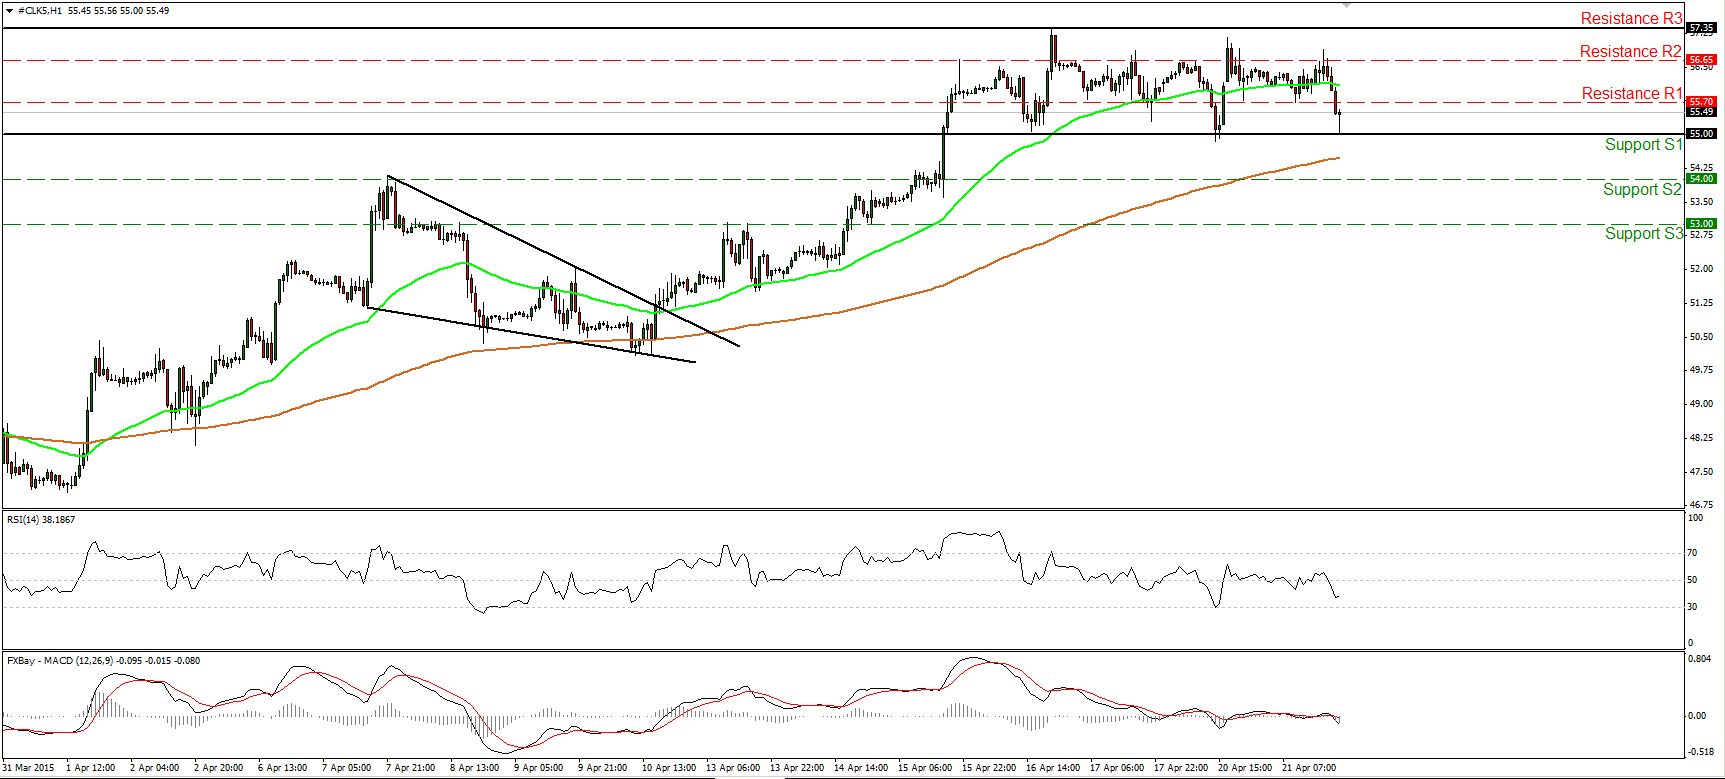
WTI traded lower on Tuesday, but hit support again at the key barrier of 55.00 (S1). WTI has been oscillating between that support and the resistance of 57.35 (R3) since the 15th of April. Thus, I would maintain my flat stance as far as the short term is concerned. Nevertheless, for the broader trend, the break above 55.00 (S2) signalled the completion of a double bottom formation on the daily chart, something that could carry larger bullish implications in the not-too-distant future. A move above the upper bound of the short-term range at 57.35 (R3) could challenge as a next resistance the 58.50 line, determined by the high of the 22nd of December.
• Support: 55.00 (S1), 54.00 (S2), 53.00 (S3).
• Resistance: 55.70 (R1) 56.65 (R2), 57.35 (R3).