IronFX Daily Commentary | 13/10/15
• Overnight, from Japan, we got the minutes of Bank of Japan September policy meeting. These are not the minutes from the most recent meeting but rather from the previous one. The minutes revealed that many members shared the view that the underlying trend in inflation continue to improve. This is in line with the BoJ Governor Kuroda reluctance to take further actions at their next meeting end of this month. The focus is now about restructuring and corporate tax reform and less about using monetary policy to boost inflation expectations. USD/JPY continued to gyrate around the psychological 120.00 level. ( see more technical below)
• Today’s highlights: During the European day, the main event will be the German ZEW survey for October. The survey for September showed a mixed picture for Eurozone’s strongest economy. The expectations index declined once again from the previous month, while the current situation index increased moderately. This time, both indices are forecast to decline a bit, which could prove negative for EUR. The final German CPI data for September confirmed the preliminary reading and showed a fall of 0.2% yoy. The market reaction at this event was modest.
• In Sweden, CPI and CPIF for September are due to be released. The CPI is expected to remain flat, while the CPIF is expected to have risen by a percentage point. At its latest meeting, the RIksbank maintained its benchmark interest rate unchanged and the monthly pace of bond purchases intact. I believe that unless we see a fall into deflation, the Bank is unlikely to alter its stance and SEK could strengthen. However, given that the Bank remains willing to act even in between ordinary meeting, I would treat any short-term strength as a correction of the longer-term USD/SEK downtrend.
• In the UK, the spotlight will be on the CPI data for September. The headline figure is expected to have remained flat, while the core rate is expected to have risen a bit. Given that last Thursday, BoE officials were concerned that inflation is likely to rise slower than previously expected, a disappointing figure is likely to push further back expectations of a rate hike by the BoE, and put GBP under renewed selling pressure.
• In the US, the NFIB small business optimism index for September is due out. Even though this indicator is not a major market mover, it is worth watching because of the Fed’s emphasis on employment, as small businesses employ the majority of people in the US. Following the disappointing NFP figure in September, this indicator could attract more attention than usual.
• As for the speakers, ECB Executive Board member Yves Mersch, St. Louis Fed President James Bullard, BoE official Andrew Haldane and BoE MPC Ian McCafferty speak
EUR/USD in a sideways mode
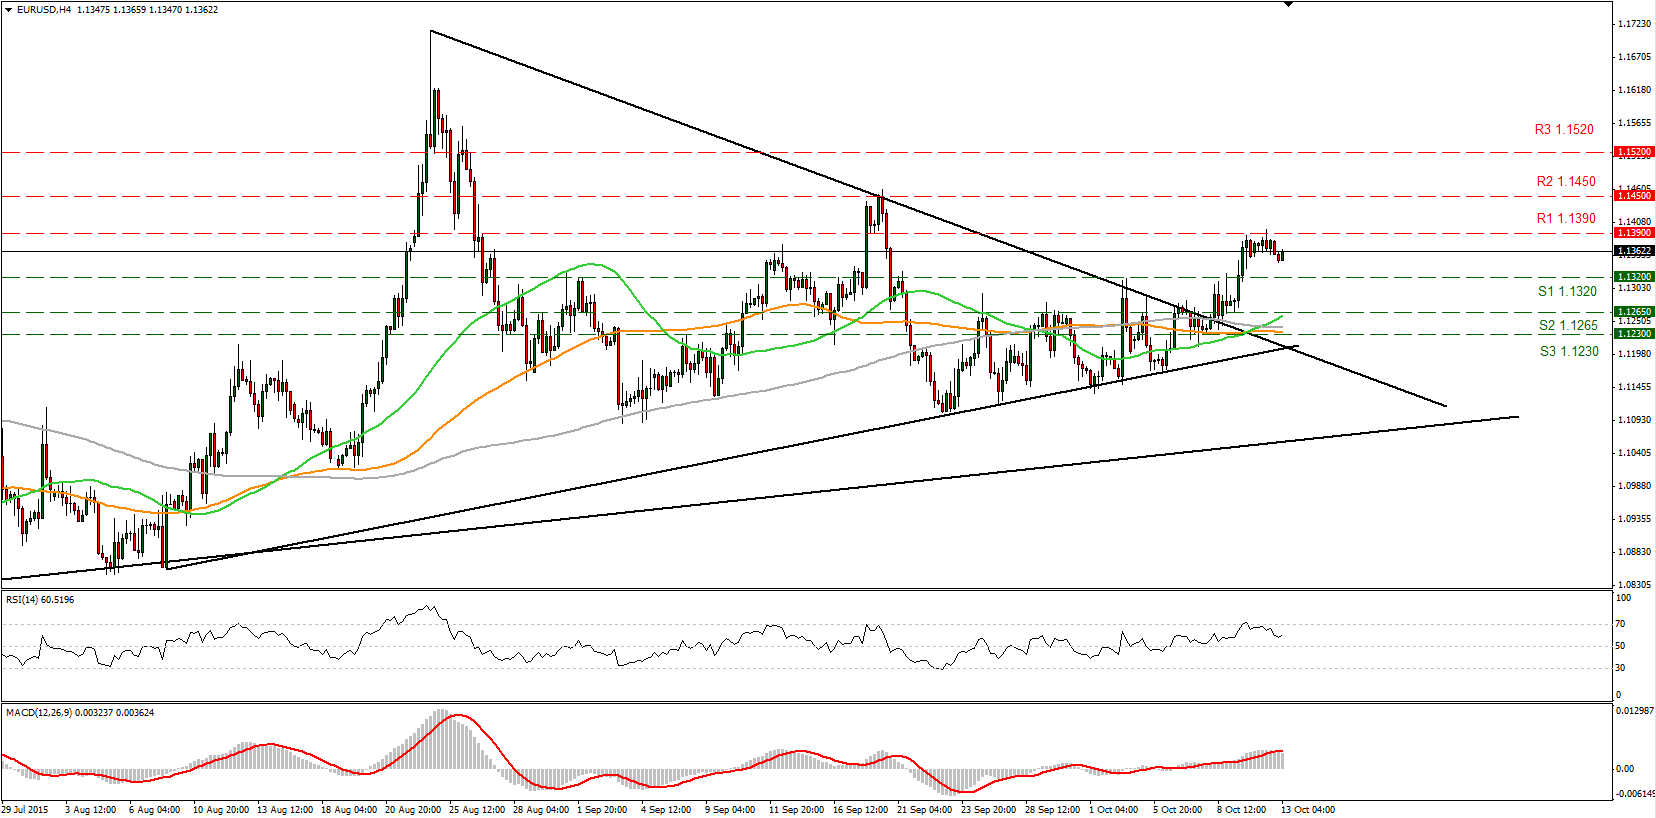
• EUR/USD traded in sideways mode on Monday, staying below our 1.1390 (R1) resistance line. The failure to break that territory despite the broad USD weakness, make me believe that the next move is likely to be lower, perhaps for a test of our 1.1320 (S1) support barrier. A break of that territory could trigger larger bearish extensions and aim for our next support at 1.1265 (S2). Our short-term momentum signs support this notion. The RSI found resistance at its 70 line and declined, while the MACD, has topped and crossed below its trigger line. As for the broader trend, as long as EUR/USD is trading between the 1.0800 key support and the psychological zone of 1.1500, I would hold a neutral stance as far as the overall picture is concerned. I would like to see another move above 1.1500 before assuming that the overall outlook is back positive. On the downside, a break below the 1.0800 hurdle is the move that could shift the picture negative.
• Support: 1.1320 (S1), 1.1265 (S2), 1.1230 (S3)
• Resistance: 1.1390 (R1), 1.1450 (R2), 1.1520 (R3)
GBP/USD finds support near 1.5300
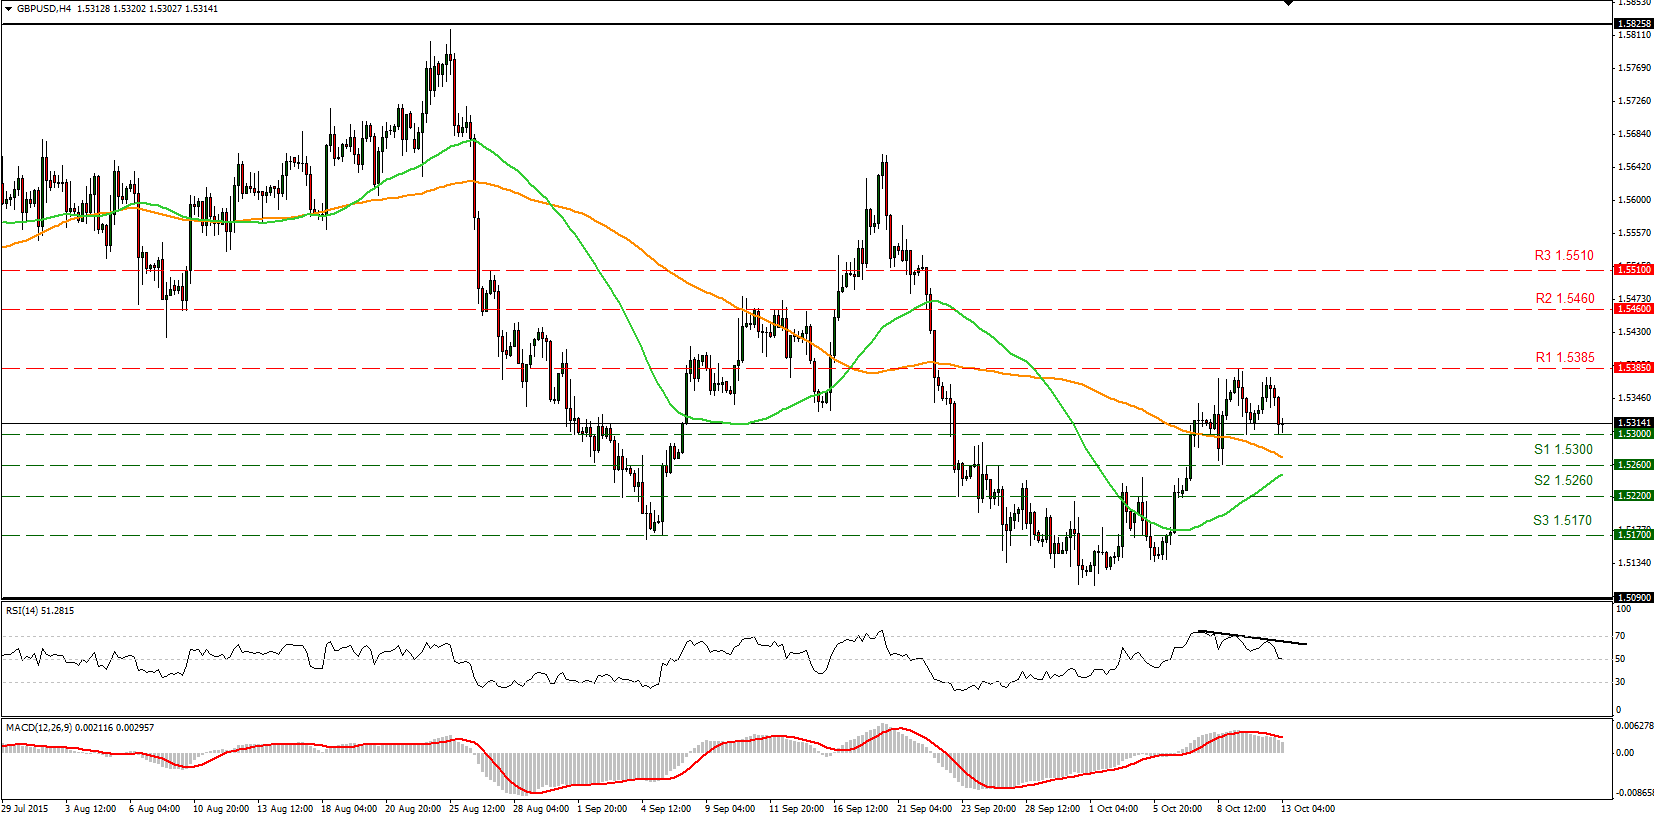
• GBP/USD advanced a bit on Monday but failed to reach our 1.5385 (R1) resistance level and in succession, the rate dropped towards the 1.5300 (S1) support level. A decisive break of that territory could push the rate lower, perhaps towards our next support of 1.5260 (S2). The catalyst for such a break could be a disappointing UK CPI for September released later today. Our short-term momentum studies support the notion for further declines. The RSI found resistance at its trend line and moved lower, while the MACD, crossed below its trigger line and points down. These momentum signs favor further declines. On the daily chart, I see that Cable remains below the 80 day exponential moving average. However, given the recent advances and the several important economic indicators coming out from the UK this week, I would adopt a “wait and see” stance as far as the overall outlook of the pair is concerned.
• Support: 1.5300 (S1), 1.5260 (S2), 1.5170 (S3)
• Resistance: 1.5385 (R1), 1.5460 (R2), 1.5510 (R3)
USD/JPY gyrates around 120.00
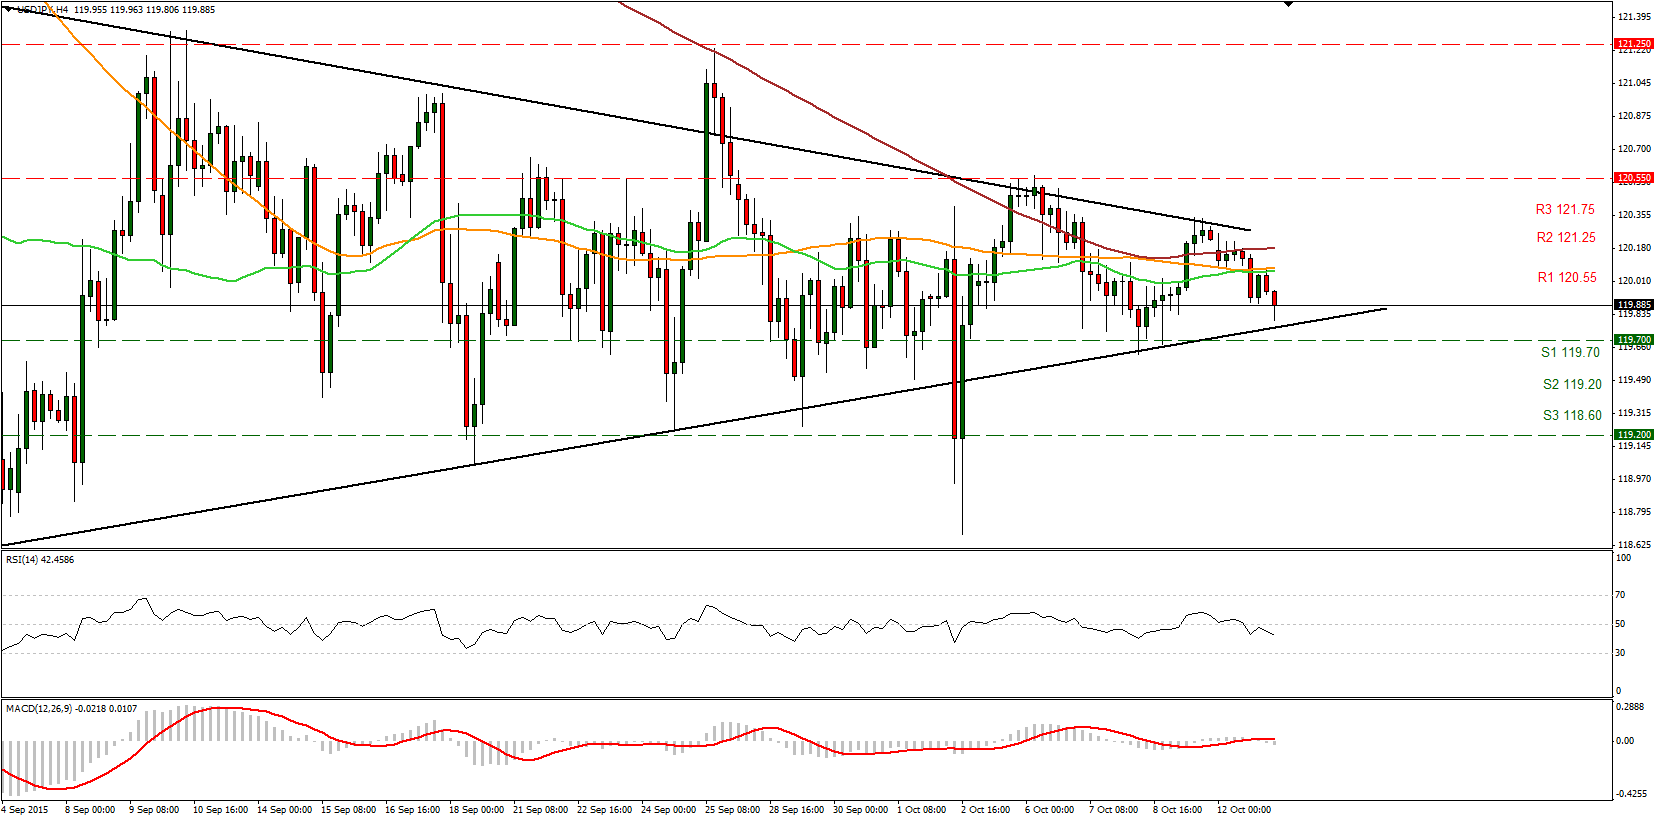
· · Support: 119.70 (S1) 119.20 (S2), 118.60 (S3)
· Resistance: 120.55 (R1), 121.25 (R2), 121.75 (R3)
Gold found resistance near 1165/70
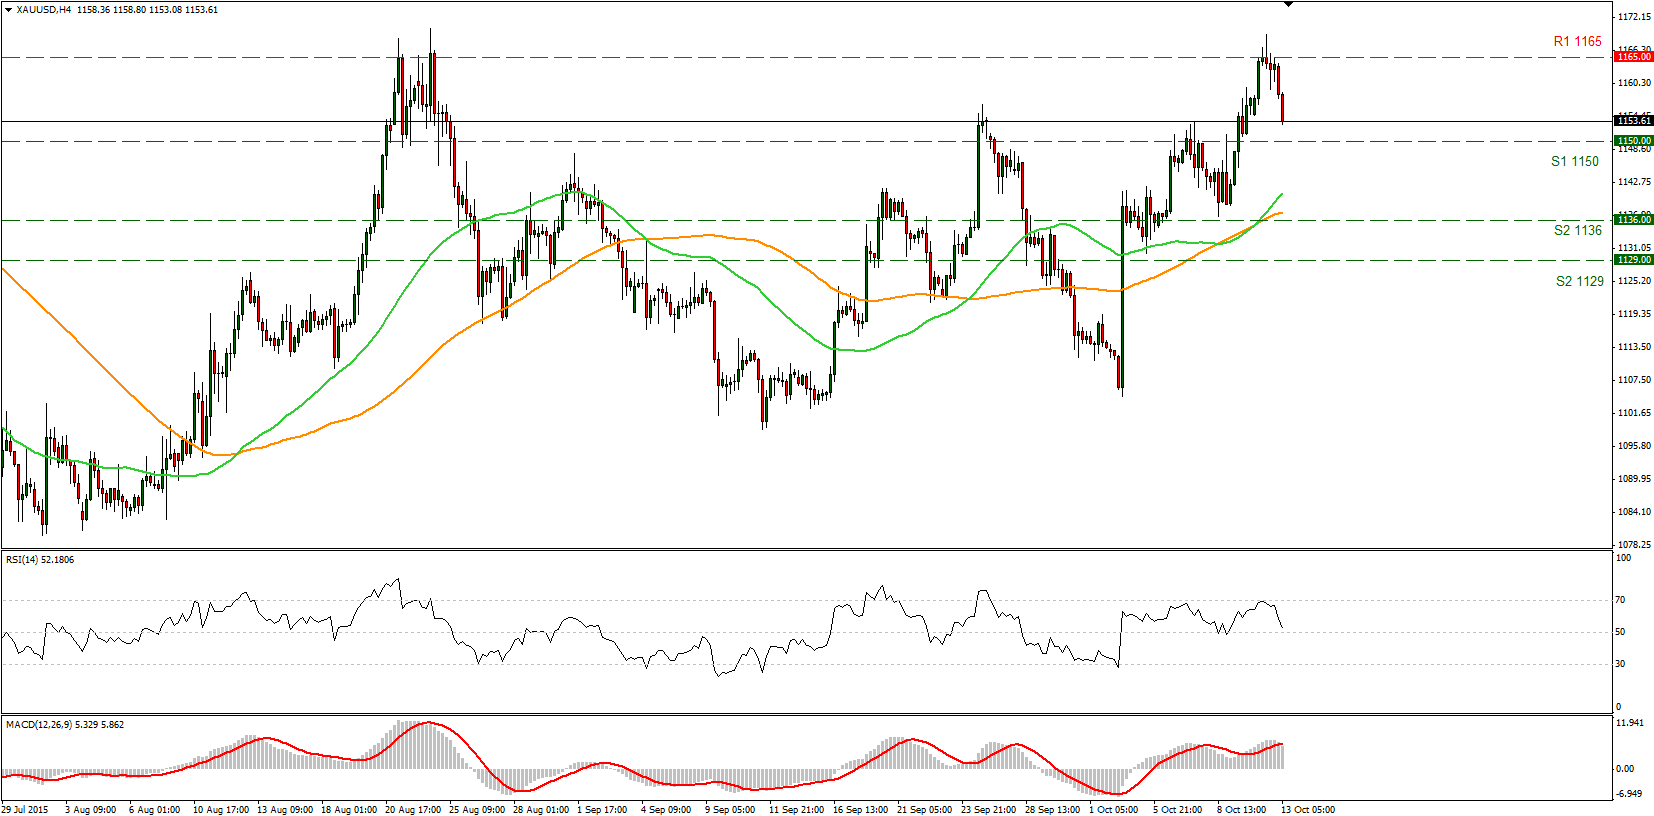
· · Gold failed to break our 1165/70 (R1) resistance zone, and fell sharply to find some buy orders slightly above the 1150 (S1) support. A break of that support area is needed to trust further declines, perhaps towards our next support at 1136 (S2). Our short-term momentum studies support the case for further declines. The RSI found resistance slightly below its 70 line and edged lower, while the MACD, although positive, has topped and fell below its signal line. As for the bigger picture, with no clear trending structure on the daily chart, I would hold my neutral stance as far as the overall outlook is concerned.
· · Support: 1150 (S1), 1136 (S2), 1129 (S3)
· · Resistance: 1165/70 (R1), 1175 (R2), 1185 (R3)