IronFX Daily Commentary | Yen skyrockets as Nikkei tumbles | 09/02/2016
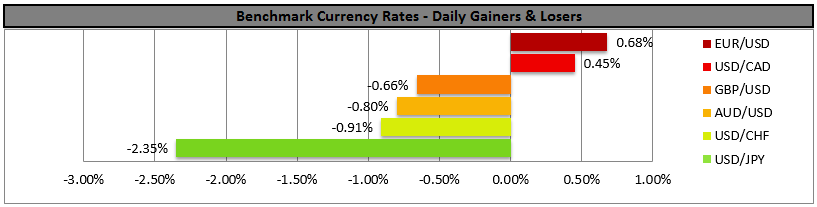
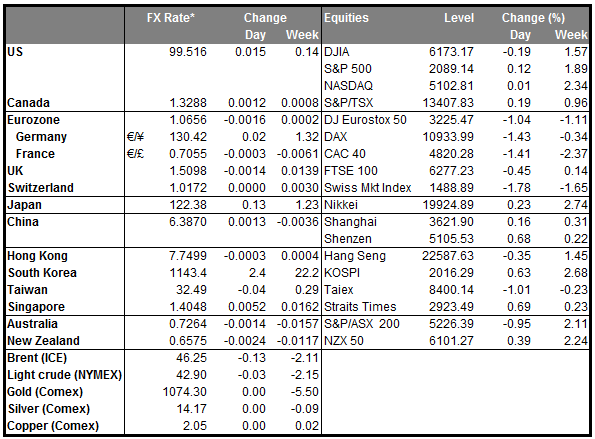
• Yen skyrockets as Nikkei tumbles Japanese stock markets plunged overnight, with the Nikkei 225 down more than 5% as investors concerns on the global economy continued to mount. Bank shares are leading the sell-off, perhaps due to persistent worries that the profitability of Japanese banks will take a hit in a negative interest rate environment. Safe haven assets, and particularly the yen, posted significant gains as investors sought shelter in the midst of this turbulence. USD/JPY dropped below the 116.00 key barrier for the first time since November 2014. The collapse in Japan’s stock market follows the plunge in European and US equities yesterday. If the risk-off environment continues to run through the European and US trading sessions today, USD/JPY could fall even lower. That could put immense pressure on the Bank of Japan to combat further appreciation of the yen, as a significantly stronger currency would pose downside risks to the inflation outlook and the competitiveness of Japanese firms. Having eased into the negative territory at its last policy meeting, the Bank may initially try to talk-down the currency, perhaps by suggesting that further appreciation could warrant policy action.
• Today’s highlights: The German industrial production figure fell even further in December from the previous month, against expectations of a minor rise.
• The UK trade deficit is forecast to have narrowed a bit in December from the previous month. However, this is usually not a major market mover.
• In the US, the Job Opening and Labor Turnover Survey (JOLTS) report for December is due to be released and the forecast is for a slight decline in the number of job openings. This survey will also report the “quit rate”, which measures workers who voluntarily resign, and is a closely watched indicator of how strong the job market is. The NFIB Business Optimism Index for January is coming out as well. Even though this indicator is not a major market mover, it is worth watching because of the Fed’s emphasis on employment, as small businesses employ the majority of people in the US. The wholesale inventories for December are also coming out.
• As for the speakers, the French and German central bank governors as well as finance ministers will hold an economic council. On Monday, the two heads of the central banks wrote in a German newspaper that the Euro area needs to push forward with structural reforms, including the creation of a Eurozone finance ministry. Any signs of strong political determination to push for the creation of such an institution could prove supportive for the common currency. ECB Governing Council member Luis Linde also speaks.
EUR/USD triggers some buy orders near 1.1085
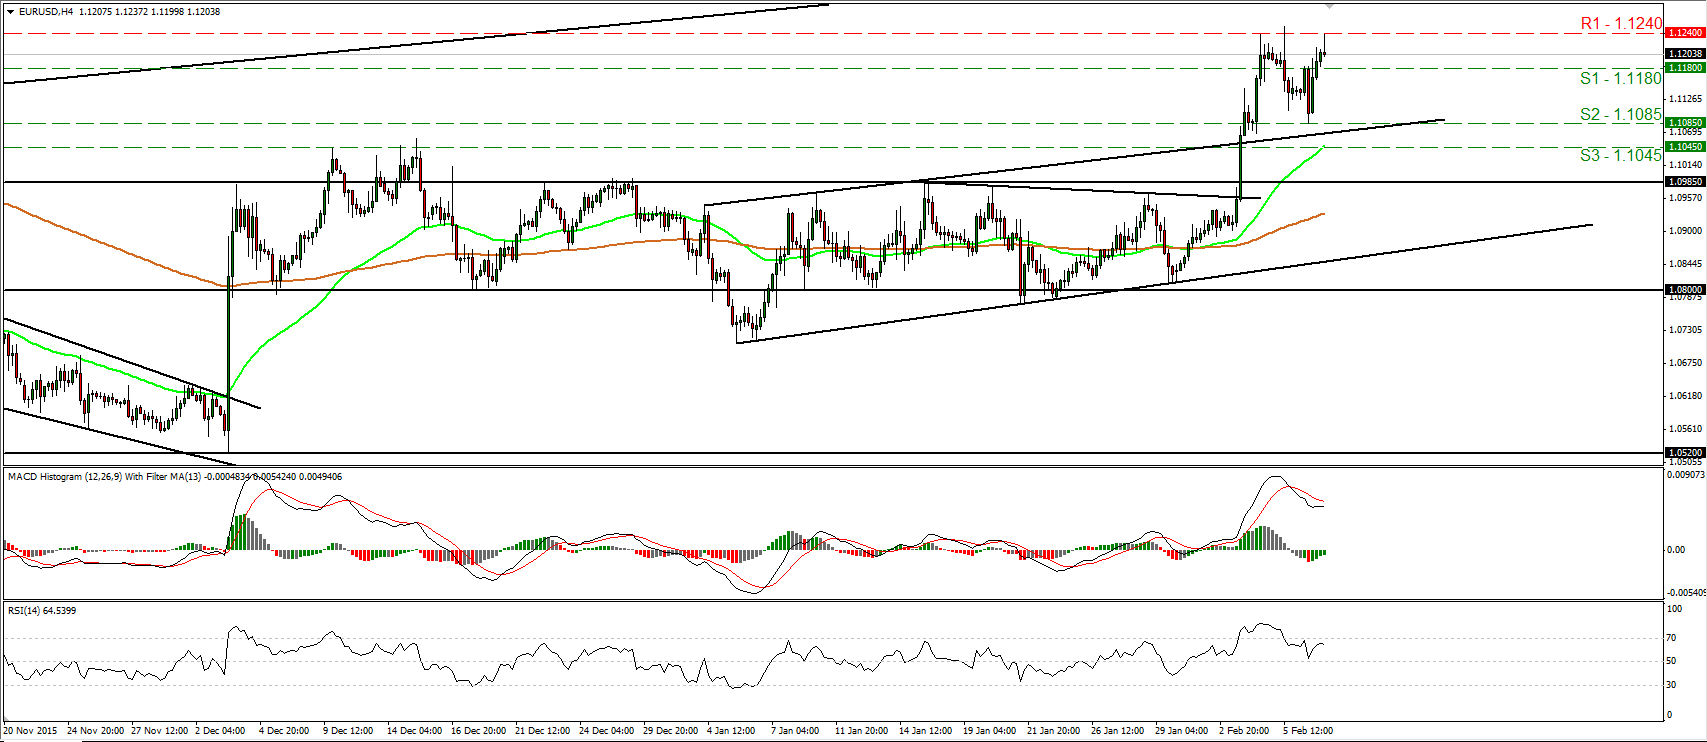
• EUR/USD traded lower yesterday, but triggered some buy orders near 1.1080 (S1) and rebounded to hit once again the 1.1240 (R1) resistance territory. Bearing in mind that on the 3rd of February the pair emerged above the 1.0985 hurdle, which is the upper bound of the sideways range it had been trading since December, I would consider the short-term outlook to be positive. A decisive move above 1.1240 (R1) would confirm a forthcoming higher high on the 4-hour chart and could open the way for the next resistance zone of 1.1300 (R2). Looking at our short-term oscillators though, I see the possibility that another setback could be looming before the bulls decide to seize control again. The RSI turned down after it hit resistance slightly below 70, while the MACD, although positive, stands below its trigger line. As for the bigger picture, as long as the rate is trading between the 1.0800 key zone and the psychological area of 1.1500, I would keep the view that the medium-term outlook stays flat.
• Support: 1.1180 (S1), 1.1085 (S2), 1.1045 (S3)
• Resistance: 1.1240 (R1), 1.1300 (R2), 1.1385 (R3)
EUR/GBP breaks above 0.7755
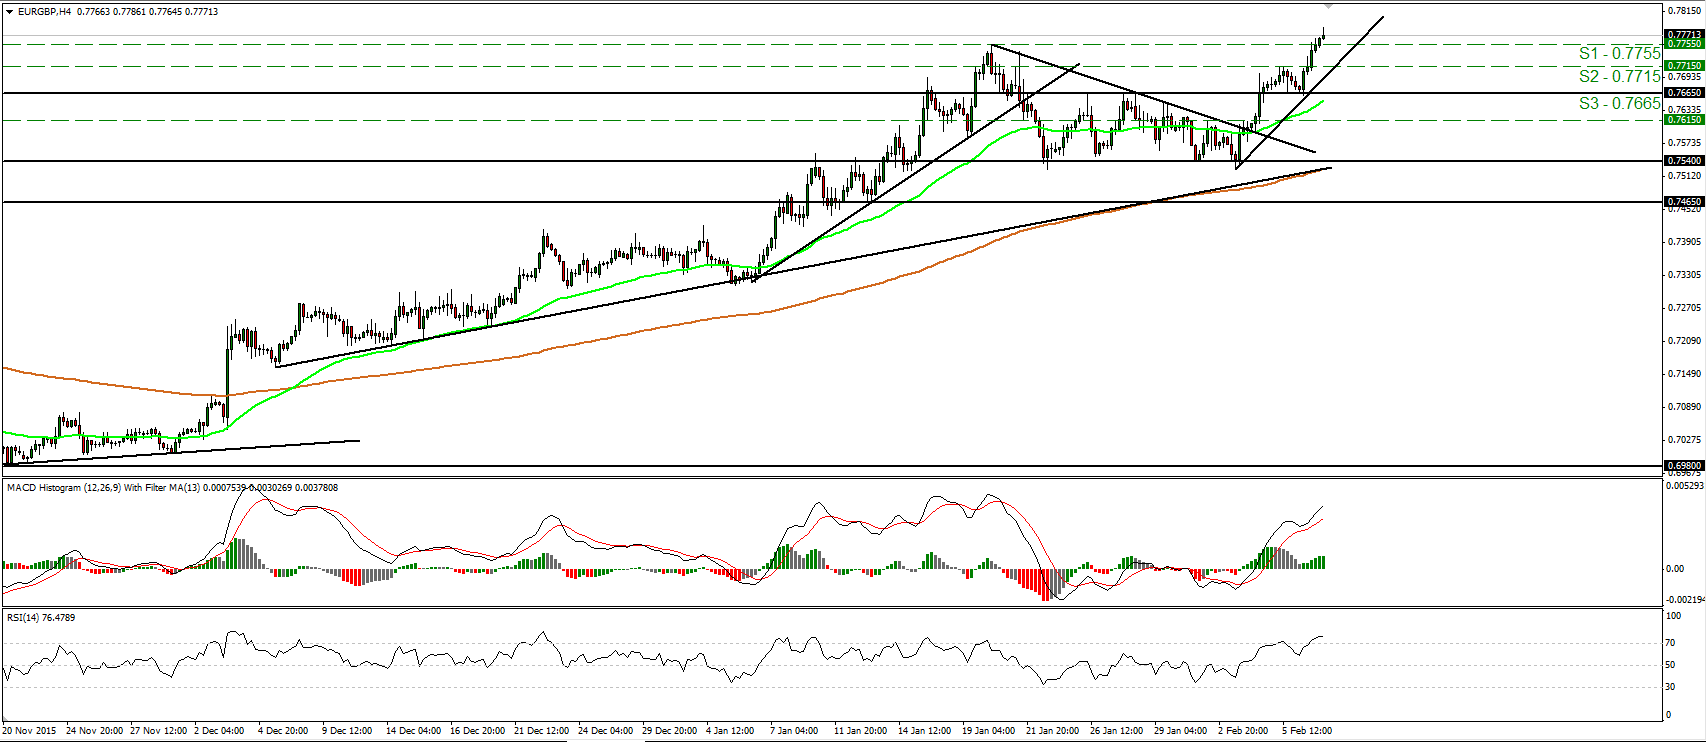
• EUR/GBP traded higher yesterday, breaking above the resistance (now turned into support) barrier of 0.7755 (S1). Taking into account that the rate edged up after it hit support at 0.7665 (S3), the upper bound of the sideways range the pair had been trading from the 21st of January until the 4th of February, I would consider the short-term outlook to be positive. I would expect the break above 0.7755 (S1) to set the stage for extensions towards our next obstacle of 0.7865 (R1). Our short-term oscillators detect strong upside speed and support the notion. The RSI emerged above its 70 line and is now pointing up, while the MACD stands above both its zero and trigger lines, and also points north. Zooming out to the daily chart, I see that on the 8th of January, the rate managed to emerge above the upper bound of the sideways range the pair had been trading since the beginning of February 2015. Therefore, I would consider the medium-term outlook to be positive as well.
• Support: 0.7755 (S1), 0.7715 (S2), 0.7665 (S3)
• Resistance: 0.7865 (R1), 0.8000 (R2), 0.8060 (R3)
USD/JPY closes below 116.00 for the first time since November 2014
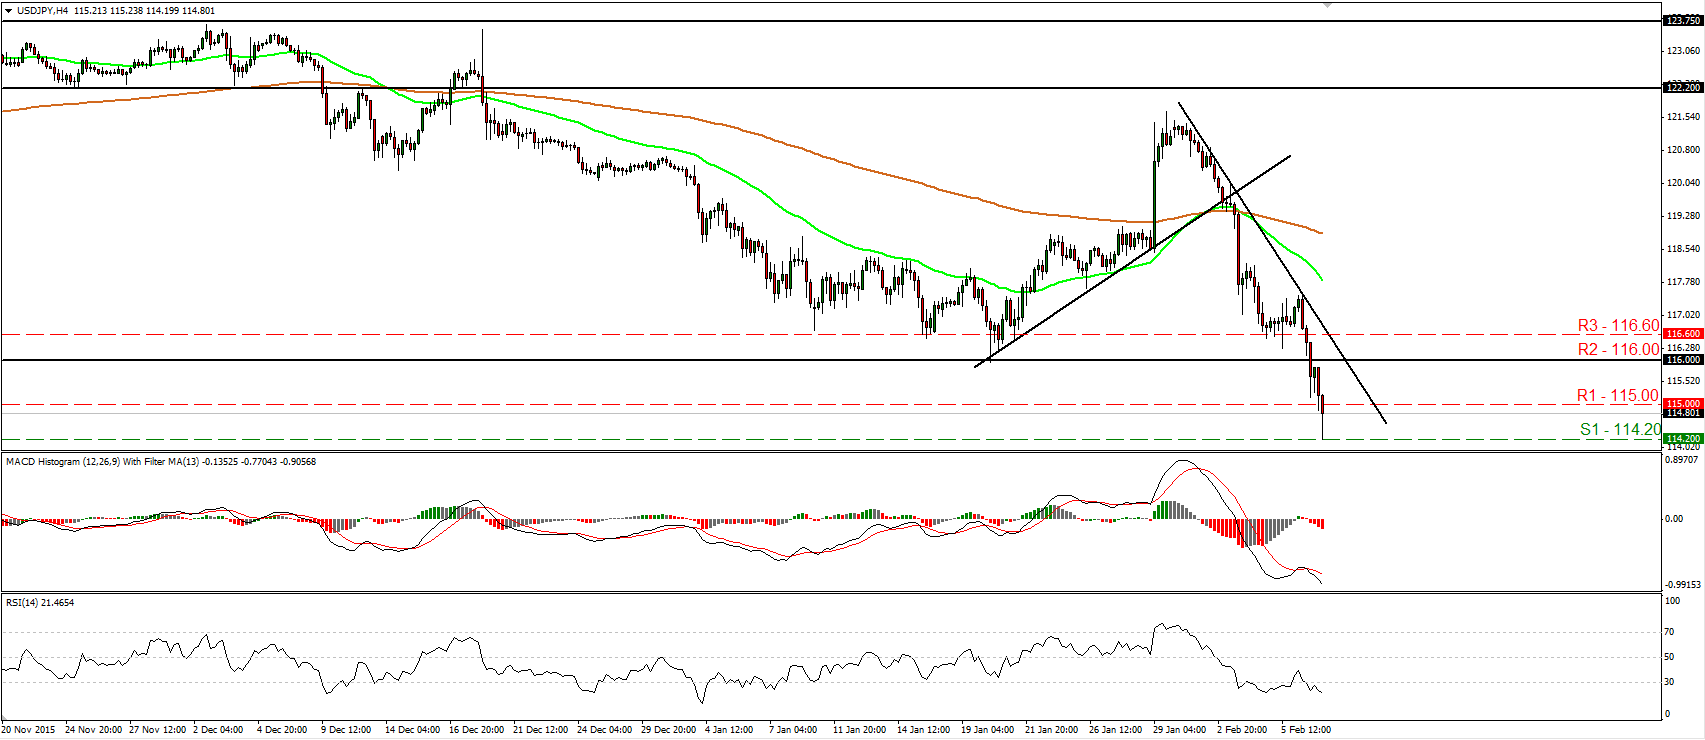
• USD/JPY tumbled yesterday, breaking and closing the day below the key support territory of 116.00 (R2). This is the first daily close since November 2014. Today, during the Asian morning, the pair continued falling and hit support at 114.20 (S1). The price structure on the 4-hour chart still suggests a downtrend and as a result, I would expect a dip below 114.20 (S1) to initially target our next hurdle of 113.90 (S2) marked by the low of the 10th of November 2014. Our short-term oscillators reveal strong downside speed and corroborate my view that USD/JPY is poised to continue lower. The RSI stands below its 30 line and points down, while the MACD lies below both its zero and trigger lines, and is pointing south as well. As for the bigger picture, I believe that the close below 116.00 (R2) has turned the longer-term outlook negative as well and could open the way for larger bearish extensions.
• Support: 114.20 (S1), 113.90 (S2), 113.20 (S3)
• Resistance: 115.00 (R1), 116.00 (R2), 116.60 (R3)
Gold hits the psychological zone of 1200
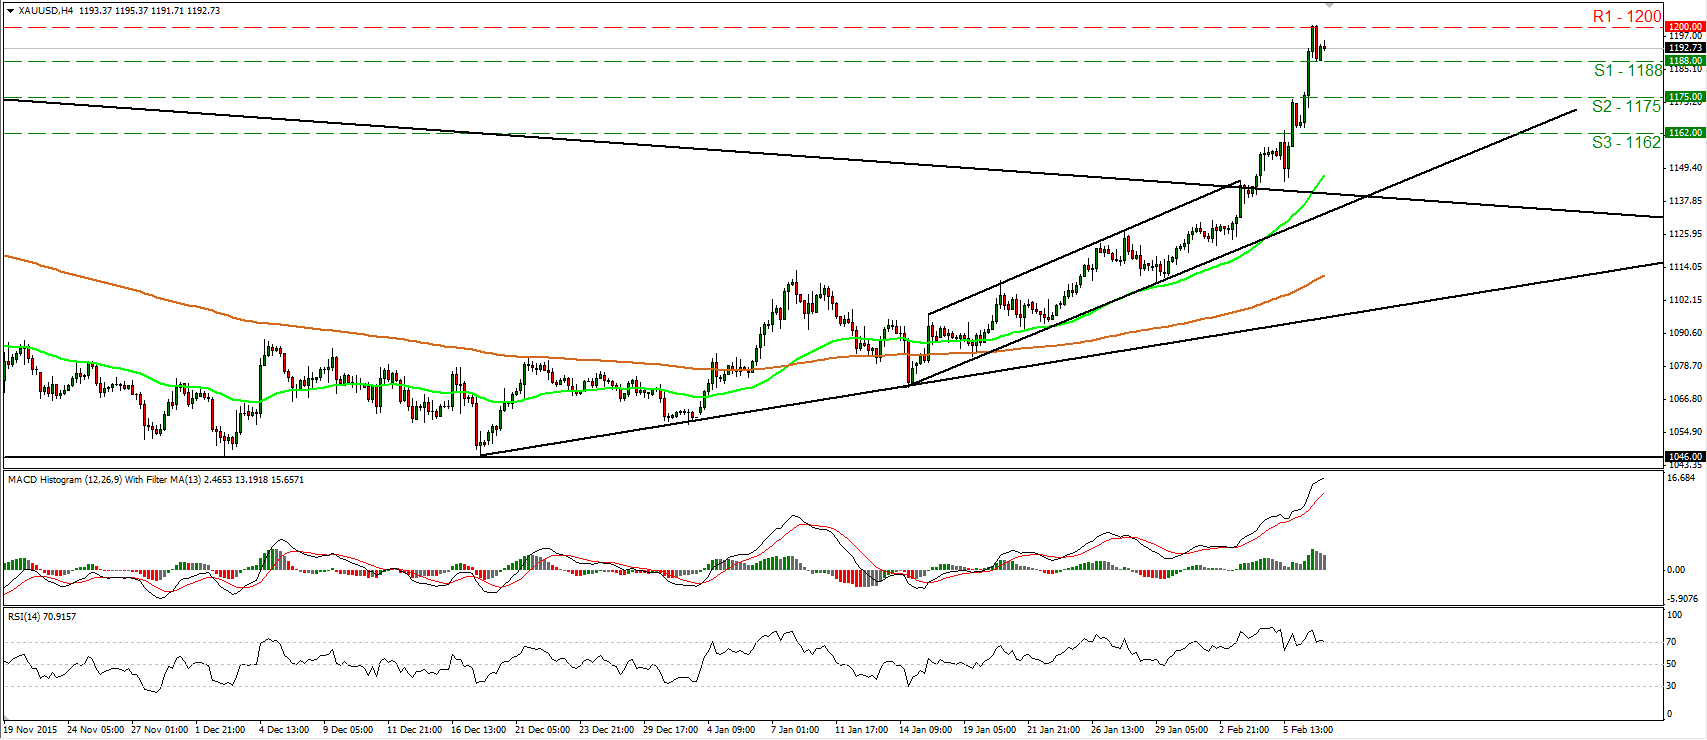
• Gold continued climbing higher on Monday and managed to reach the psychological zone of 1200 (R1). Then, the metal pulled back and hit support at 1188 (S1). The price structure on the 4-hour chart still suggests an uptrend and therefore, I would expect a clear move above the 1200 (R1) zone to target our next resistance of 1215. (R2). However, taking a look at our short-term oscillators, I see the likelihood that another setback could be looming before the next positive leg. The RSI looks ready to move back below its 70 line, while the MACD, at extreme positive levels, shows signs that it could start topping. Switching to the daily chart, I see that on the 4th of February, the price broke above the long-term downside resistance line taken from the peak of the 22nd of January 2015. As a result, I would consider the medium-term outlook to be positive as well.
• Support: 1188 (S1), 1175 (S2), 1162 (S3)
• Resistance: 1200 (R1), 1215 (R2), 1230 (R3)
WTI slides below 30.35
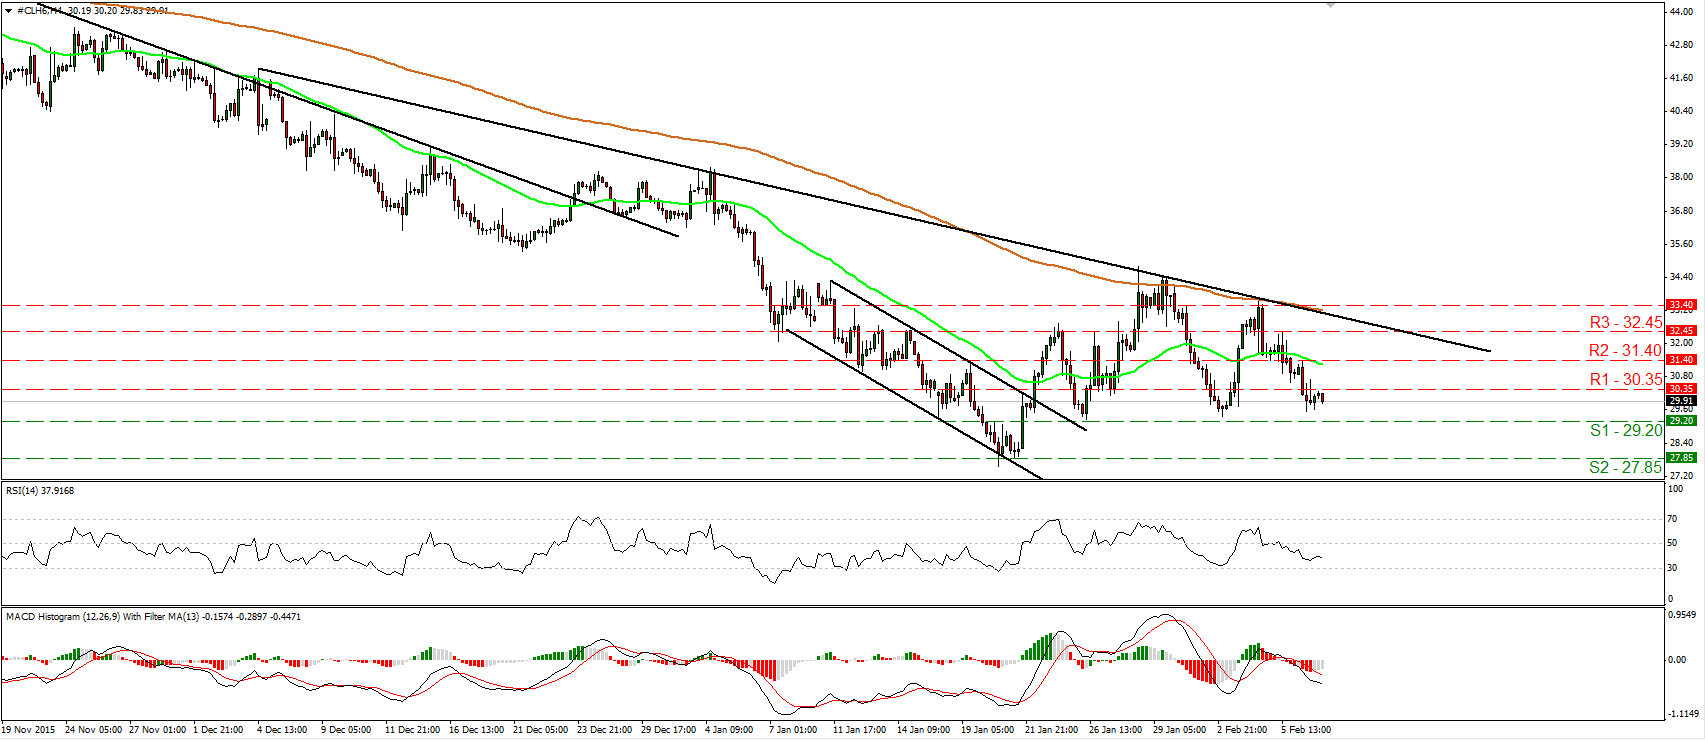
• WTI continued trading lower on Monday, fell below the support (now turned into resistance) line of 30.35 (R1), and hit support slightly above the 29.20 (S1) support zone. Given that the price is still trading below the downtrend line taken from the 4th of December, I would consider the bias to stay negative. I would expect a clear dip below 29.20 (S1) to open the way for the next obstacle of 27.85 (S2), defined by the lows of the 20th and 21st of January. Our near-term oscillators reveal negative momentum and amplify the case for WTI to continue trading lower. The RSI stands below its 50 line and points down, while the MACD lies below both its zero and trigger lines, pointing south as well. On the daily chart, I see that WTI has been printing lower peaks and lower troughs since the 9th off October. What is more, the decline started on the 29th of January, has probably confirmed that the recovery from 27.85 was just a corrective phase. As a result, I would consider the longer-term picture of WTI to stay negative.
• Support: 29.20 (S1), 27.85 (S2), 25.00 (S3)
• Resistance: 30.35 (R1), 31.40 (R2), 32.45 (R3)